 Ginnie Mae [1]’s share of outstanding mortgage-backed securities in May 2016 was 27.6 percent, just edging out Freddie Mac [2]—marking the first time ever that Ginnie Mae has had more outstanding securities than Freddie Mac, according to data from the Urban Institute.
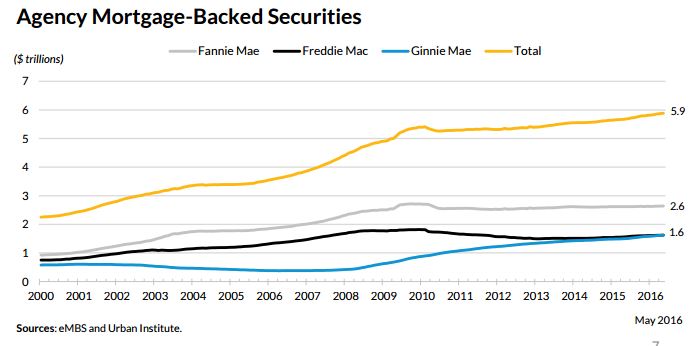
The Urban Institute’s June 2016 Chartbook [3] indicated that in May 2016, aggregate agency outstanding securities totaled about $5.89 trillion. The majority of these securities were guaranteed by Fannie Mae [4] (44.6 percent). Ginnie Mae had 27.6 percent of the market; Freddie Mac, due to rounding, also had 27.6 percent.
“What’s most important about this milestone is not that we have passed Freddie Mac in outstanding mortgage-backed securities, but that Ginnie Mae’s public-private partnership model assured credit access would continue for borrowers and supported the housing recovery,” Ginnie Mae president Ted Tozer said. “The strength of this partnership has enabled more than 10 million families achieve the American dream. This is a tribute to the staff at Ginnie Mae and the private sector diligently working together to expand and enhance affordable housing finance.”
Debt in the private-label securitization market totaled $606 billion in April 2016, according to the Urban Institute, with the majority of the debt in Alt-A loans (42.1 percent), followed by subprime (38.6 percent) and prime (19.3 percent). Agency mortgage-backed securities made up about 58.5 percent of the total mortgage market; private-label securities made up about 5.8 percent.
Unsecuritized first-liens at the GSEs, commercial banks, savings institutions, and credit unions made up 29.4 percent, while second liens comprised about 6.2 percent, according to Urban Institute.
The overall value of the residential housing market as of the end of Q1 increased to $23.71 trillion due to increases in total debt and mortgages (up to $10.01 trillion) and household equity (up to $13.70 trillion).
Click here [3] to view the complete Urban Institute Chartbook for June 2016.