
 DSNews The homepage of the servicing industry


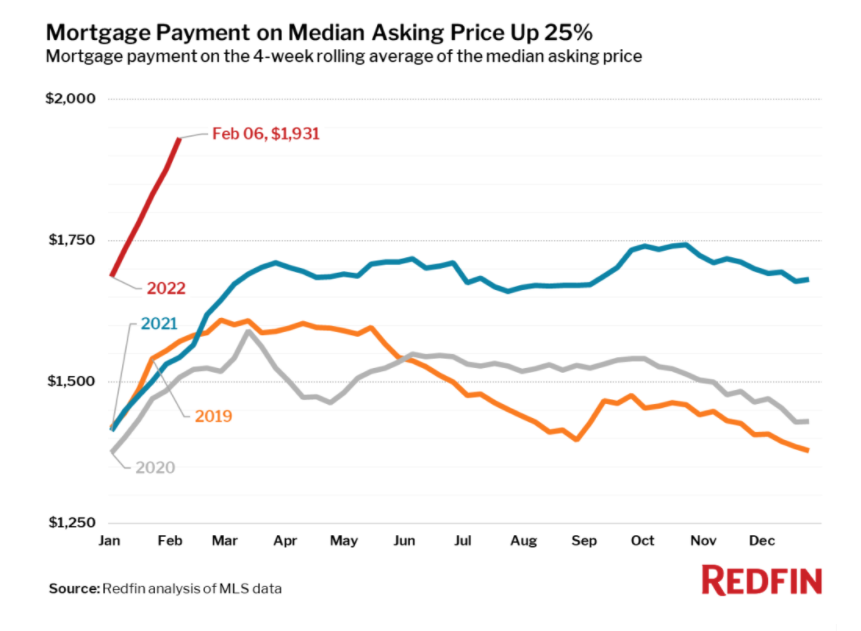
 The estimated monthly mortgage payment for a typical home for sale rose 25% year over year to a record $1,931, according to a new report from Redfin. Numbers are based on the all-time high median asking price of $376,000 recorded during the four weeks ending February 6, and an average 30-year mortgage rate of 3.69%.
Pending sales were down slightly from the same period in 2021, but 34% higher than they were two years earlier, weeks before the pandemic began. Meanwhile, the number of homes for sale was down 29% from a year earlier and down 50% from 2020. This constricted supply is depressing home sales, as mortgage purchase applications fell 10% during the week ending February 4.
As a result, the market’s pace is accelerating. Some 55% of homes that found a buyer spent two weeks or less on the market—the highest rate on record for this time of year.
“Movers are feeling a big pinch. There is nowhere for them to run from increasing housing costs now that mortgage rates are rising and inflation has spread to the rental market,” said Redfin Chief Economist Daryl Fairweather. “Homebuyers feel uneasy making offers on homes with such high asking prices, but there is no better alternative. Would-be homebuyers who bowed out last year are kicking themselves, but delaying purchasing a home another year could be a costly mistake. My advice to buyers who are worried they will have to overbid in order to win a home is to make sure they can see themselves living in the home for at least five years. I expect home values to rise over that time horizon even if there are short-term fluctuations in the housing market. Given how tough the housing market is for movers, it makes sense that so many homeowners are staying put. It’s also contributing to the shortage of new listings and making the market even tougher for buyers.”
Housing Market highlights for 400+ U.S. metros:
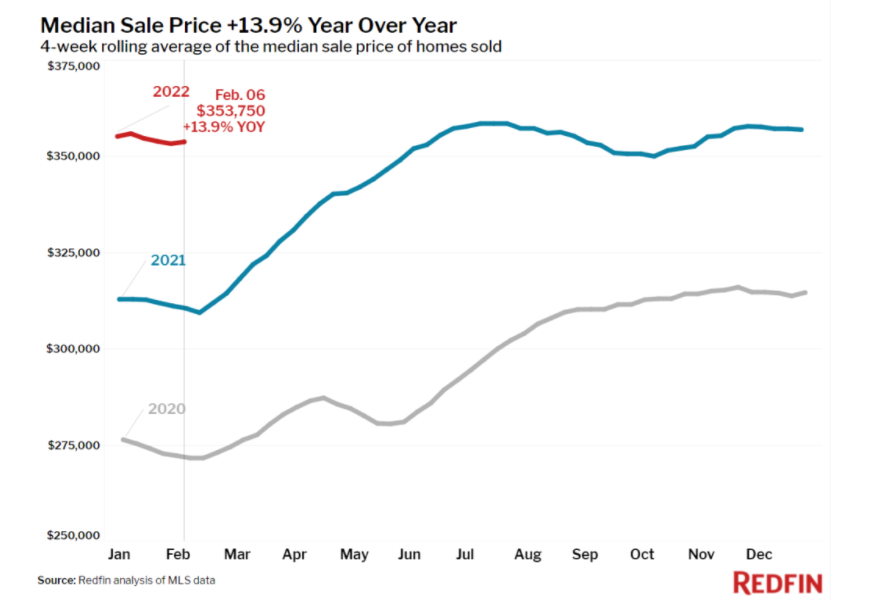
- The median home sale price was up 14% year over year to $353,750.
- The median asking price of newly listed homes increased 15% year over year to an all-time high of $376,000.
- The monthly mortgage payment on the median asking price was up 25% from a year earlier to an all-time high of $1,931. This was up 28% from the same period in 2020.
- Pending home sales were down 0.5% year over year, but sales were up 40% from the same period in 2020, just prior to the start of the pandemic.
- New listings of homes for sale were down 10% from a year earlier. Compared to January 2020, new listings were down 12%.
- Active listings (the number of homes listed for sale at any point during the period) fell 29% year over year, dropping to an all-time low of 440,000. Listings were down 50% from the same period in 2020.
- 55% of homes that went under contract had an accepted offer within the first two weeks on the market, above the 49% rate of a year earlier and 41% in 2020. This is the highest the measure has ever been in January, and the highest level since March.
- 43% of homes that went under contract had an accepted offer within one week of hitting the market, up from 37% during the same period a year earlier and 29% in 2020. This measure is at a record high.
- Homes that sold were on the market for a median of 29 days, down from 38 days a year earlier and 59 days in 2020.
- 41% of homes sold above list price, up from 32% a year earlier and 19% in 2020.
- On average, 2.8% of homes for sale each week had a price drop, up 0.3 percentage points from the same time in 2021, but down 0.6 percentage points from 2020.
- The average sale-to-list price ratio, which measures how close homes are selling to their asking prices, was 100.2%. In other words, the average home sold for 0.2% above its asking price.
Other leading indicators of homebuying activity included:
- Mortgage purchase applications decreased 10% week over week (seasonally adjusted) during the week ending February 4. For the week ending February 10, 30-year mortgage rates rose to 3.69%, the highest level since January 2020.
- Touring activity through February 6 was 3 percentage points behind 2021 and 2 points behind 2020 relative to the first week of January, according to home tour technology company ShowingTime.
- The Redfin Homebuyer Demand Index rose 1% during the week ending February 6 and was up 9% from a year earlier.
To view the full report, including charts and methodology, click here.


