
 DSNews The homepage of the servicing industry


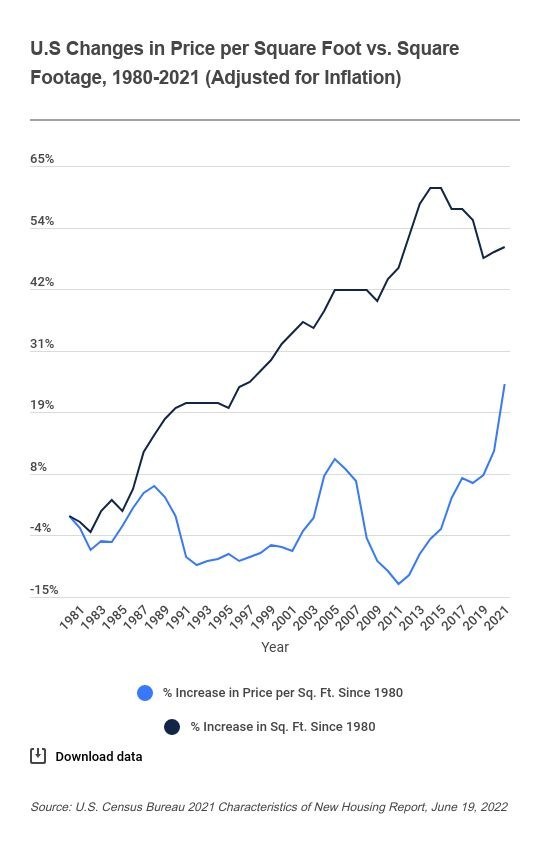
 The average price per square foot of a home hit a new record in July as a new study revealed that these prices have increased 310% since 1980.
According to Home Bay, a California-based real estate brokerage, the increase in the price of a square foot of property has exceeded inflation by 139% since 2020 topping out at $169 per square foot.
As a benchmark, a new single-family home currently has a median square footage of 2,356 with an average price of $397,100 per home averaging $169 per square foot. Comparing these numbers to 1980, the cost per square foot was $42, as astronomical rise of 310%.
“We've already found that raises in annual income are barely keeping pace with inflation. Since 2000, the overall price of goods in the U.S. has risen by 67%. After adjusting for inflation, however, the median American household income has increased by just 7% in the same time period. That’s only 0.3% per year.”
According to Home Bay, examining the price per square foot is more important than it was in the past due to the fact that housing prices are also outpacing income. Home Bay went on to further analyze metropolitan areas at the top and bottom of price per square foot using data from the U.S. Census Bureau, the U.S. Bureau of Labor Statistics, and Realtor.com.
The study ranked the 50 most-populous U.S. metros by price per square foot and found that the cities with the highest price per square foot are:
- San Jose, California ($801)
- San Francisco, California ($656)
- Los Angeles, California ($520)
- San Diego, California ($494)
- New York, New York ($458)
The cities with the lowest price per square foot are:
- Memphis, Tennessee ($92)
- Cleveland, Ohio ($103)
- Pittsburgh, Pennsylvania ($134)
- Indianapolis, Indiana (134)
- Buffalo, New York ($139)
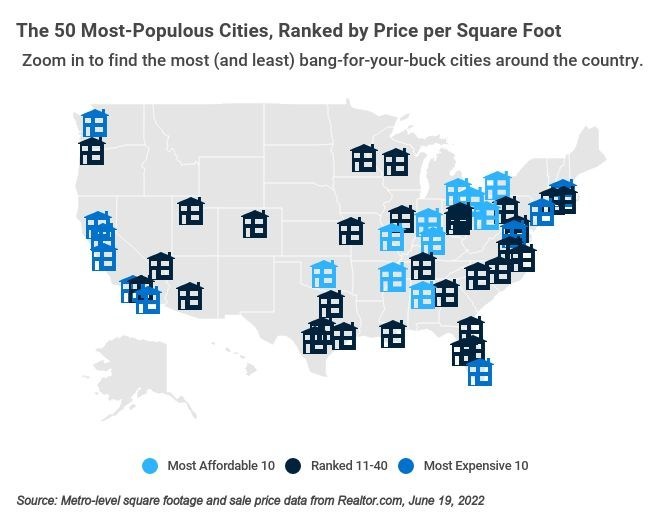
The 50 Most-Populous Cities, Ranked by Price per Square Foot
Home Bay additionally found that Memphis—while also recording the lowest price per square foot—had the biggest houses nationwide with a square footage of 2,630. The median square footage of a newly built single-family home has increased 50% since 1980 from 1,570 to 2.356 today while the occupancy rate decreased from 2.8 to 2.5 meaning people today have more space per person than previous generations.
Click here to read the full report.


