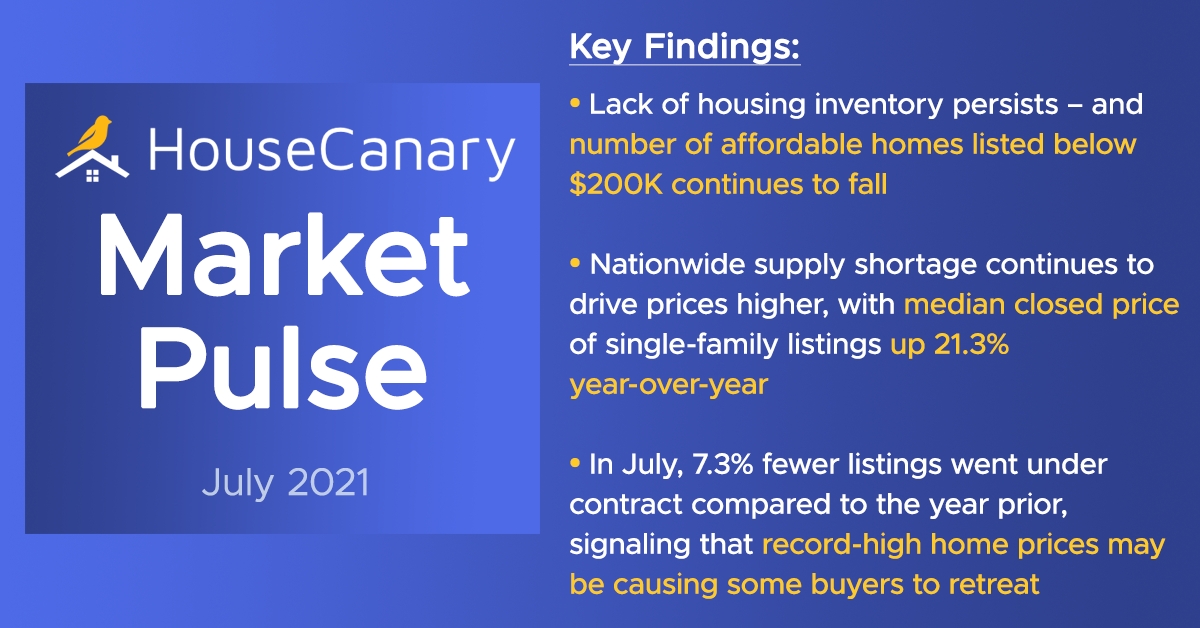
 HouseCanary’s latest Market Pulse report [1], covering 22 listing-derived metrics and comparing data between July 2020 and July 2021, has found that the while the nation’s housing supply remains a detriment for the market, net new listings and the number of listings under contract shrinking is a positive sign that is rectifying itself.
In terms of total net new listings, since July 2020, there have been 3,073,143 net new listings placed on the market, a 12.3% increase versus the same period in 2019. The percentage of total net new listings over the last 52 weeks, broken down by home price:
- $0-$200k: 19.0%
- $200k-$400k: 41.7%
- $400k-$600k: 20.0%
- $600k-$1mm: 12.8%
- >$1mm: 6.5%
The percent change in net new listing activity over the last 52 weeks versus the same period in 2019, broken down by home price:
- $0-$200k: (-17.4%)
- $200k-$400k: +4.0%
- $400k-$600k: +37.6%
- $600k-$1mm: +64.1%
- >$1mm: +77.9%
“The nationwide inventory shortage continues to dominate the current market, but the narrowing chasm between net new listings and the number of listings under contract is a positive sign that the supply-demand imbalance is slowly diminishing,” said Jeremy Sicklick, Co-Founder and CEO of HouseCanary. “In the meantime, as we’ve observed throughout the pandemic, properties below $200K are significantly underperforming as the confluence of strong demand and limited inventory has led to record-high home prices–even in areas that were once considered affordable. Although mortgage rates dipped slightly in July, many prospective homebuyers appeared unable to take advantage due to expensive valuations and limited supply.”

In July, monthly new listing volume was down 3.7% compared to the same month in 2020. In July, there were 319,418 net new listings placed on the market, representing a 3.8% decrease year-over-year. The percent change in net new listing activity year-over-year, broken down by home price:
- $0-$200k: (-16.4%)
- $200k-$400k: (-10.8%)
- $400k-$600k: +11.2%
- $600k-$1mm: +19.6%
- >$1mm: +7.5%
Over the last year (July 2020-July 2021), 3,330,913 properties have gone into contract, representing a 7.4% increase relative to the same period in 2019. The percentage of total contract volume since July 2020, broken down by home price:
- $0-$200k: 19.2%
- $200k-$400k: 42.0%
- $400k-$600k: 19.7%
- $600k-$1mm: 12.5%
- >$1mm: 6.6%
The percent change in contract volume over the last 52 weeks versus the same period in 2019, broken down by home price:
- $0-$200k: (-21.6%)
- $200k-$400k: +0.6%
- $400k-$600k: +30.7%
- $600k-$1mm: +56.2%
- >$1mm: +76.8%
For the month of July, there were 350,182 single-family detached home listings that went under contract nationwide, a 7.3% decrease year-over-year. For the month of July, the percent change in contract volume compared to July 2020, broken down by home price:
- $0-$200k: (-18.8%)
- $200k-$400k: (-13.3%)
- $400k-$600k: +3.8%
- $600k-$1mm: +13.0%
- >$1mm: +9.0%
For the week ending July 30, 2021, the median price of all single-family listings in the U.S. was $386,681, a 10.4% increase year-over-year. For the week ending July 30, 2021, the median closed price of single-family listings in the U.S. was $394,541, a 21.3% increase year-over-year. The study also found that the median price of all single-family listings in the U.S. is down 1.3% month-over-month and the median price of closed listings has increased by 0.8% month-over-month.
