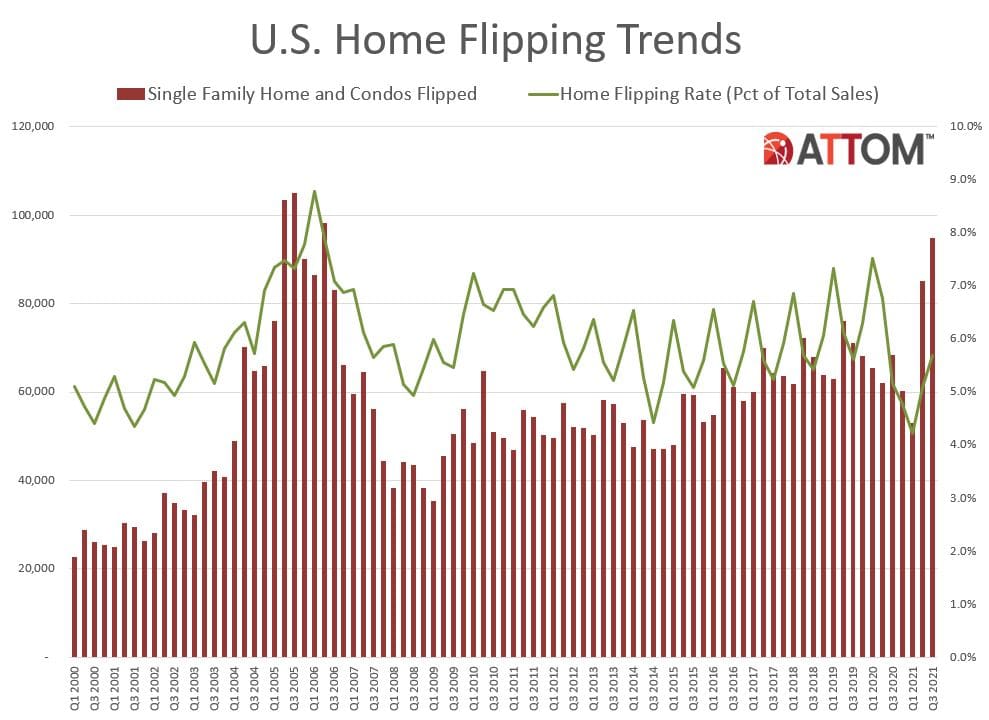
 Flipping houses are all the rage as the real estate market remains at near record levels going into 2022. According to a new report from ATTOM [1], 94,766 homes were flipped in the third quarter representing 5.7% of all transactions—to put that another way, 1 in 18 houses that were sold in the third quarter were flipped.
The number of homes flipped has been increasing since the start of the year and are up 5.2% and 5.1% from the first and second quarters, respectively.
While the number of homes being flipped is at the highest levels seen since 2005, profit margins on these homes are down and are mirroring lows not seen since 2011.
The average flip in the third quarter earned $68,847, which translates to a 32.3% on return on investment. Profit margins have been trending downwards recently due to a variety of mitigating factors including the costs of raw materials and labor; this decrease has been the largest seen since the market crash in 2009.
Profit margins also declined as the prices on flipped homes continue to rise more slowly than they did when they bought the home.
“Specifically, the median price of homes flipped in the third quarter of 2021 shot up to another all-time high of $281,847,” ATTOM said in the report. “That was up 4.8% from $269,000 in the second quarter of 2021 and 22.5% from $230,000 a year earlier. The annual increase stood out as the largest for flipped properties since 2005 while the quarterly gain was the second biggest since 2015.”
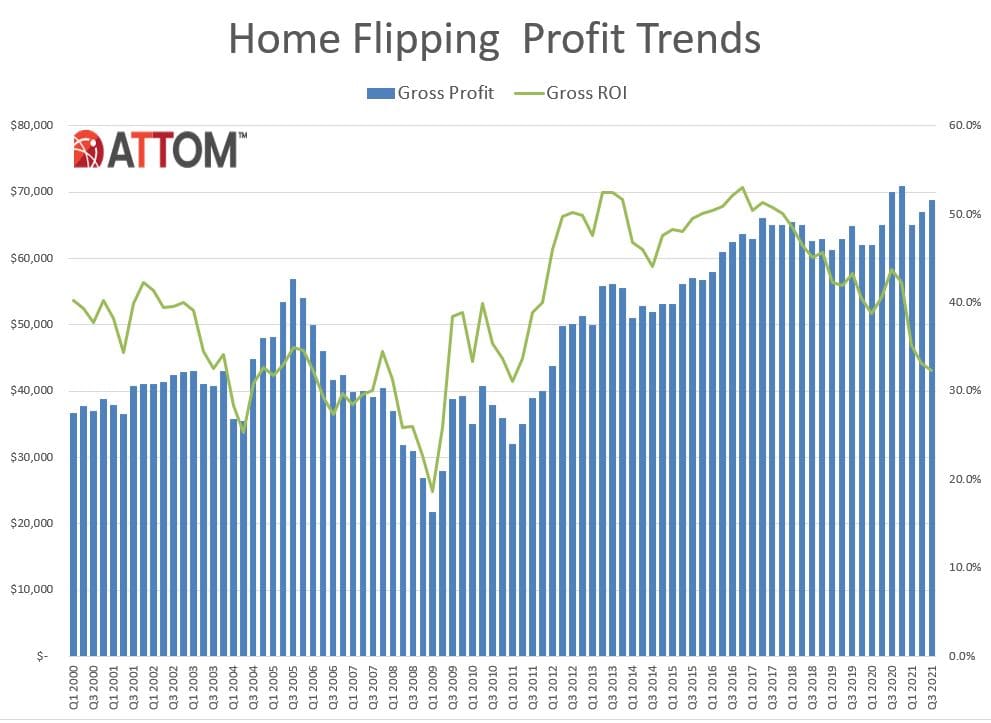
“But the latest resale price run-ups again failed to surpass increases that investors were absorbing—5.4% quarterly and 33.1% annually—when they bought the homes that were sold in the third quarter of this year. That gap—prices rising less on resale than on purchased—led to profit margins dropping again.”
"Home flipping produced another round of competing trends in the third quarter of this year as more investors got in on the action but got less out of it," said Todd Teta [2], Chief Product Officer at ATTOM. "It's clear that declining fortunes weren't enough to repel investors amid a typical scenario of 32 percent profits before expenses on deals that usually take an average of five months to complete. We will see over the coming months whether the amount they can make on these quick turnarounds will still be enough to keep luring them into the home-flipping business or start pushing them elsewhere."
Of the 195 metropolitan tracked by ATTOM, flips as a portion of all home sales increased quarter-over-quarter in 142 of those cities.
Among those metro areas, the largest flipping rates during the third quarter of 2021 were in Ogden, Utah (flips comprised 9.5% of all home sales); Phoenix, Arizona (9.5%); Salisbury, Maryland (9.3%); Salt Lake City, Utah (9.3%) and Laredo, Texas (9.2%).
Aside from Phoenix and Salt Lake City, the highest flipping rates during the third quarter of 2021 in 53 metro areas with a population of 1 million or more were in Memphis, Tennessee (9%); Oklahoma City, Oklahoma (8.8%) and Austin, Texas (8.5).
The smallest home-flipping rates in the third quarter were in Honolulu, Hawaii (0.8%); Portland, Oregon (2.5%); Rochester, New York (2.5%); Manchester, New Hampshire (2.7%) and Santa Rosa, California (2.7%).
On a national level, the average time a contractor took to flip a house from purchase to sale stood at 147 days during the third quarter. This was down one day from the previous quarter and down from 189 days last year.