
 The Urban Institute December Housing Chartbook brought some welcome news for mortgage delinquency and foreclosure rates. Similar to the latest reports from CoreLogic and ATTOM Data Solutions, the chartbook found that these levels are still dropping after the unprecedented levels seen following the housing crisis. Despite this positive trend, Urban Institute reports that these rates are still relatively high compared to those of pre-crisis in the early 2000’s.
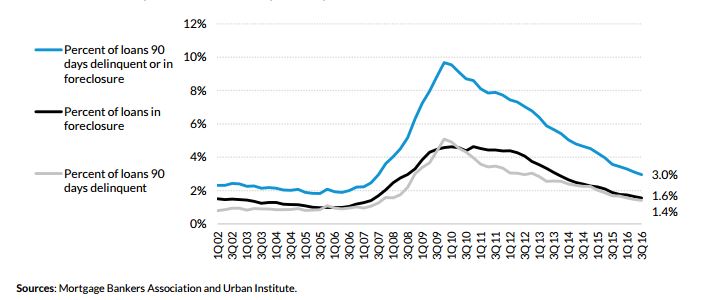
“Loans 90 days delinquent or in foreclosure totaled 3.0 percent in the third quarter of 2016,” said the report, “down from 3.6 percent for the same quarter a year earlier.”
In addition to the nationwide rates, seriously delinquent rates for GSE loans also declined. The chartbook noted that as of October 2016, 1.21 percent of the Fannie Mae portfolio and 1.03 percent of the Freddie Mac portfolio were seriously delinquent. This was a decrease from 1.58 percent for Fannie Mae and 1.38 percent for Freddie Mac from the year prior, according to the report.
Alongside the decline in GSE seriously delinquent loans, FHA and VA loans also decreased even further, according to the chartbook.
“GSE delinquencies remain higher relative to 2005-2007, while FHA and VA delinquencies (which are higher than their GSE counterparts) are now at levels lower than 2005-2007,” said Urban Institute.
With the decline in delinquencies decline in permanent loan modifications, which is another sign of market recovery. Broken down even further, the data from the chartbook reports that the number of active permanent modifications declined by 4,870, making this quarter the third consecutive quarter.
“Fewer new permanent modifications were made, some modifications failed because the borrowers did not make their payments, and a small number of borrowers either paid off their mortgage or withdrew their application,” said the report. “As a result, active permanent mods declined to 0.97 million.”
To view the full December 2016 Housing Chartbook, click HERE. [1]