A new Creditnews report [1] has revealed the most and least "house poor" states in 2024, with an estimated 1 in 3 American households considered to be house/cost burdened.
While home affordability remains an obstacle for Americans nationwide, "house poor” is a term that refers to families that spend 30% or more of their gross income on housing costs. According to the Department of Housing and Urban Development (HUD), households above that threshold are much more likely to run into financial challenges.
Creditnews Research researched the latest Census Bureau data to assess the housing costs of existing homeowners and how many of them are currently struggling to keep roofs over their heads.
Key Findings:
- Nationwide, 30.8% of homeowners, whether with or without a mortgage, are considered to be “house poor.”
- Among homeowners with a mortgage, 37.2% are spending on housing above their means.
- Surprisingly, 20.8% of homeowners without mortgages fall into the same category.
- On a state level, California (43%), Hawaii (42.4%), New York (39.3%), New Jersey (37.7%), and Massachusetts (37.1%) have the greatest share of house-poor households.
- Interestingly, Hawaii, Massachusetts, New Jersey, and California—four of these states—are in the top ten by average inflation-adjusted income over the past 12 months.
- States with the lowest percentage of house-poor residents include West Virginia (19.5%), North Dakota (22.1%), Indiana (22.7%), Iowa (22.8%), and South Dakota (23.6%). Households in these states earn less than the national average ($73,477).
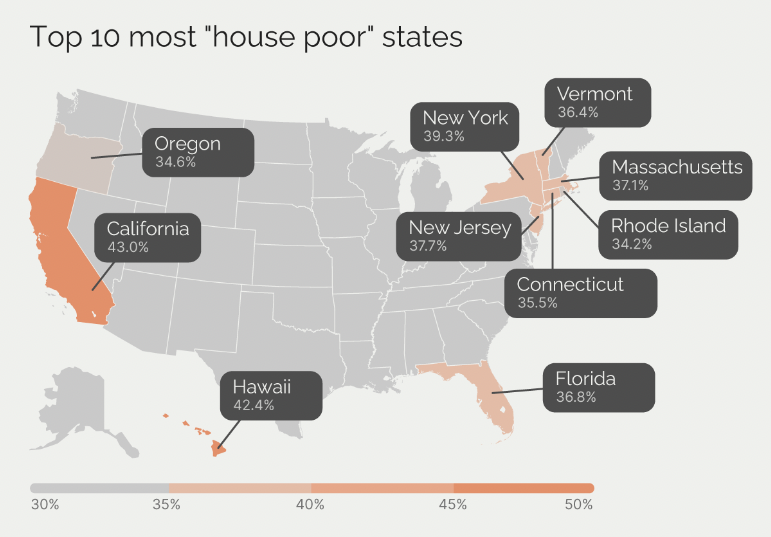
- California (percentage of "house poor" households: 43%)
- Hawaii: 42.4%
- New York: 39.3%
- New Jersey: 37.7%
- Massachusetts: 37.1%
- Florida: 36.8%
- Vermont: 36.4%
- Connecticut: 35.5%
- Oregon: 34.6%
- Rhode Island: 34.2%
The Top 10 Least "House Poor" States:
- West Virginia (percentage of "house poor" households: 19.5%)
- North Dakota: 22.1%
- Indiana: 22.7%
- Iowa: 22.8%
- South Dakota: 23.6%
- Ohio: 23.8%
- Arkansas: 23.8%
- Nebraska: 24.1%
- Missouri: 24.1%
- Kansas: 24.5%
Across the nation, nearly one in three—an estimated 30.8%—homeowners are considered to be "house poor". This number jumps to 37.2% for those who have an active mortgage.
Approximately one in five (20.8%) homeowners who don’t have a mortgage find themselves in the same boat, suggesting that the rising costs of maintaining a home (i.e., utilities, property tax, insurance, repairs, etc.) are "taking their toll", according to Creditnews experts.
On a state level, California has the highest share of house-poor households, followed by Hawaii, New York, New Jersey, Massachusetts, and Florida.
To read the full report, including more data, charts, and methodology, click here [1].