
 DSNews The homepage of the servicing industry


 While roughly twice as many foreclosure sales occurred within the month as compared to December 2020, there were only one-third as many as in pre-pandemic December 2019. Given the large volume of borrowers who've exited forbearance protections in recent months, the industry are keeping a close eye on foreclosure metrics moving forward in 2022.
Black Knight Inc. released the following "first look" at December 2021 month-end mortgage performance statistics derived from its loan-level database representing the majority of the national mortgage market.
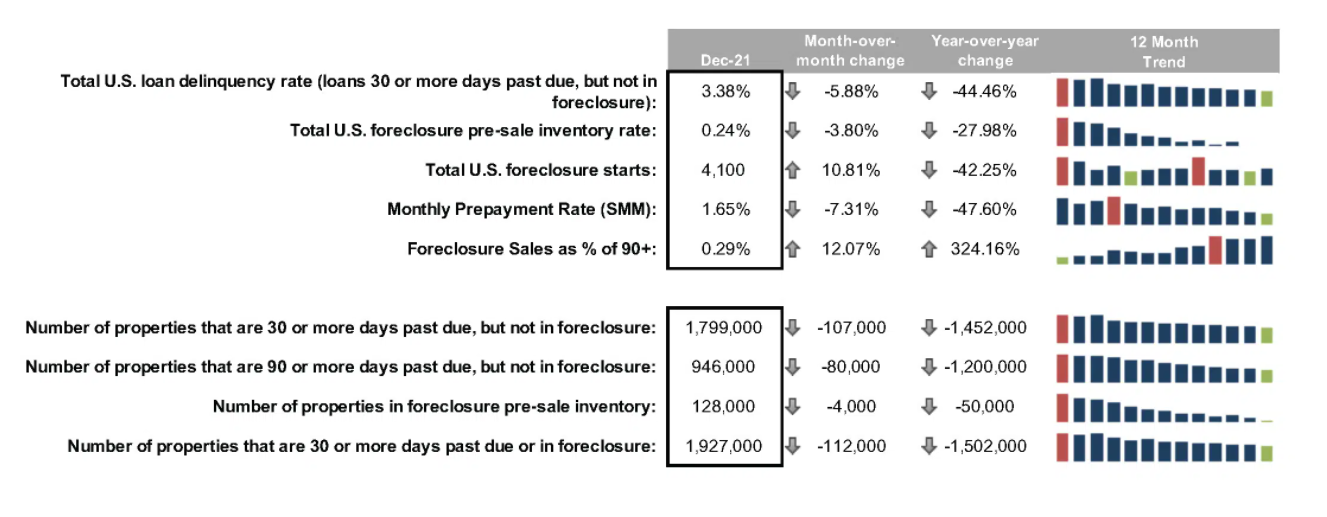
Total U.S. loan delinquency rate (loans 30 or more days past due, but not in foreclosure): 3.38%
- Month-over-month change: -5.88%
- Year-over-year change: -44.46%
Total U.S. foreclosure pre-sale inventory rate: 0.24%
- Month-over-month change: -3.80%
- Year-over-year change: -27.98%
Total U.S. foreclosure starts: 4,100
- Month-over-month change: 10.81%
- Year-over-year change: -42.25%
Monthly prepayment rate (SMM): 1.65%
- Month-over-month change: -7.31%
- Year-over-year change: -47.60%
Foreclosure sales as % of 90+: 0.29%
- Month-over-month change: 12.07%
- Year-over-year change: 324.16%
Number of properties that are 30 or more days past due, but not in foreclosure: 1,799,000
- Month-over-month change: -107,000
- Year-over-year change: -1,452,000
Number of properties that are 90 or more days past due, but not in foreclosure: 946,000
- Month-over-month change: -80,000
- Year-over-year change: -1,200,000
Number of properties in foreclosure pre-sale inventory: 128,000
- Month-over-month change: -4,000
- Year-over-year change: -50,000
Number of properties that are 30 or more days past due or in foreclosure: 1,927,000
- Month-over-month change: -112,000
- Year-over-year change: -1,502,000
Some 0.24% of loans are in active foreclosure in December, a historic low, with the month's 4,100 foreclosure starts almost 90% below December 2019 levels. Prepayment activity fell by more than 7% in December and is projected to fall even further as rising rates continue to erode refinance incentive.
Top five states by non-current percentages were:
- Louisiana: 7.06%
- Mississippi: 6.91%
- West Virginia: 5.37%
- Alabama: 5.11%
- Oklahoma: 5.08%
Bottom five states by non-current percentage:
- Utah: 2.20%
- California: 2.13%
- Washington: 2.03%
- Colorado: 2.02%
- Idaho: 1.85%
Top five states by 90+ Days delinquent percentage:
- Louisiana: 3.84%
- Mississippi: 3.41%
- Oklahoma: 2.55%
- Alabama: 2.52%
- Arkansas: 2.50%
Top 5 states by 6-month improvement in non-current percentage:
- Hawaii: -46.54%
- Nevada: -35.61%
- California: -34.04%
- Vermont: -27.62%
- Washington: -27.28%
For a more detailed view of this month's data from Black Knight, click here.


