
Will there be any financial relief surrounding elevated home prices in 2024?
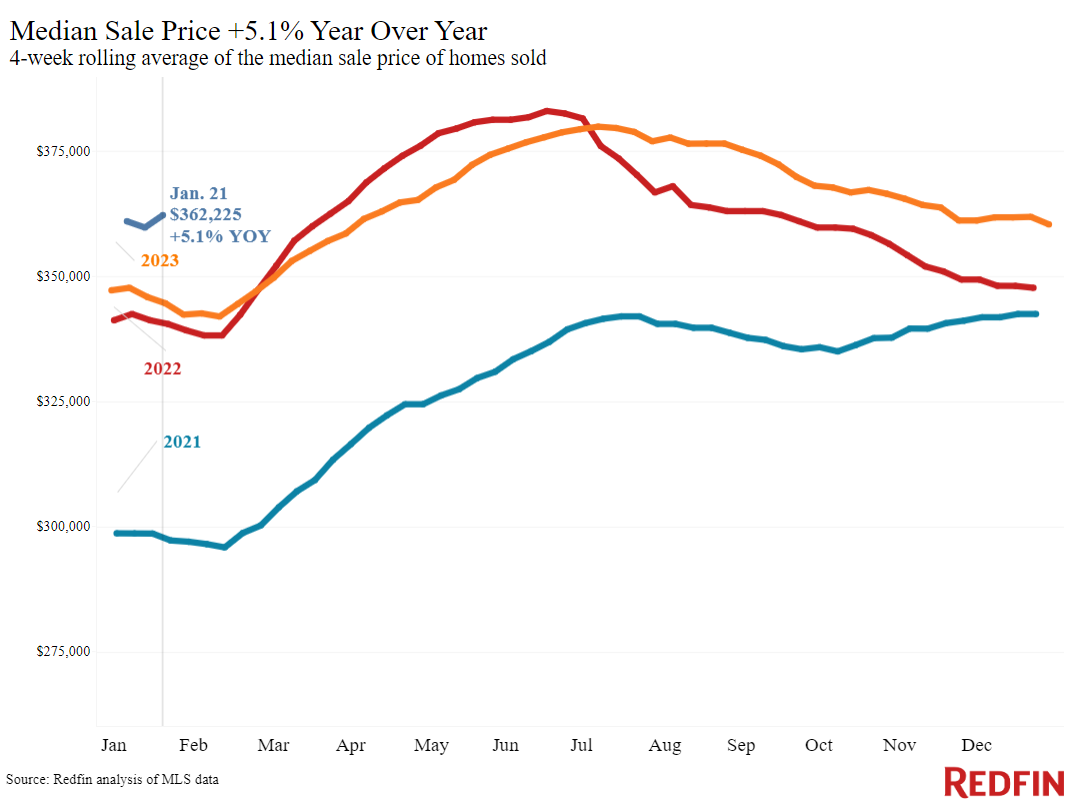
According to a new report from Redfin, [1] the median home sale price in the U.S. rose 5.1% during the four weeks ending January 21, representing the biggest increase since October 2022. Asking prices rose approximately 6.5%, also posting the biggest increase since October 2022.
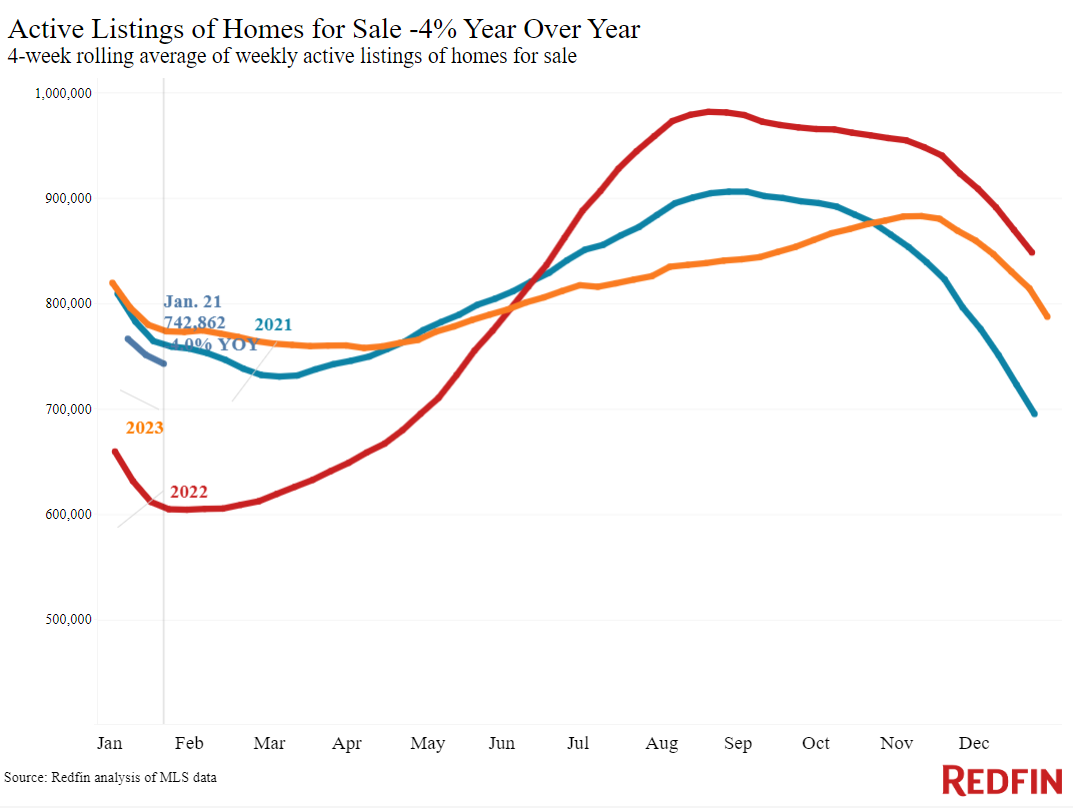
Prices are rising for a few reasons. One, inventory is still quite low. The total number of homes for sale is down 4% year-over-year. New listings are also up 2%, representing the smallest annual increase in two months. Home sellers can command higher prices because buyers have more purchasing power, as mortgage rates are holding steady in the mid-to-high 6% range, down from 8% in October.
Recent sales data showed sluggish activity as severe winter weather kept many homebuyers and sellers on the sidelines in much of the U.S. Pending home sales are down 8% year-over-year, marking the biggest decline in four months.
The significant annual drop in pending sales is due in part to a base effect from last January, as pending sales were improving at this time last year while mortgage rates fell.
Leading Indicators of Homebuying Demand and Activity:
- The weekly average 30-year fixed mortgage rate was 6.6% as of the week ending January 18, representing the lowest level since May and up from 6.15%, according to Freddie Mac.
- Mortgage-purchase applications were up 8% from a week earlier, up 17% from a month earlier as of the week ending January 19, and down 18%, according to the Mortgage Bankers Association (MBA).
- Google searches for “home for sale” were up 18% from a month earlier as of January 20, down approximately 15%, according to Google Trends.
- The Redfin Homebuyer Demand Index was down 8% from a month earlier as of the week ending January 21, down an estimated 21%.
Metros with biggest year-over-year (YoY) increases in median sale price:
- Anaheim, CA (13.6%)
- New Brunswick, NJ (13.5%)
- Miami (13.3%)
- Newark, NJ (12.6%)
- Providence, RI (11.8%)
The average median sale price declined in just four metros across the U.S.
Metros with biggest YoY decreases in median sale price:
- Austin, TX (-3.7%)
- San Antonio, TX (-2.2%)
- Oakland, CA (-1.8%)
- Jacksonville, FL (-1%)
With some Americans facing colder climates, Redfin agents report that many would-be buyers are choosing not to bear the brunt of the the harsh weather, but that mortgage-purchase applications are rising, and in warmer places, demand is picking up.
“Real estate is usually slow in the Midwest in the winter, but this year it’s even slower than usual because the weather has been so extreme," said Grand Rapids, MI, Redfin Premier agent Christine Kooiker. “Casual house hunters are staying home to avoid the roads—but inventory is low enough that serious buyers are finding a way to see desirable homes. I also believe we’ll get busier as we approach spring. People are used to higher mortgage rates, and they know prices are likely to go up more if they wait.”

Metros with biggest YoY increases in new listings:
- San Diego (22.3%)
- Phoenix (21.6%)
- Minneapolis (20.4%)
- Miami (18.8%)
- Fort Lauderdale, FL (18.7%)
While some metros showed positive increases, new listings declined in approximately 14 U.S. metros.
Metros with biggest YoY decreases in new listings:
- Chicago (-20.4%)
- Atlanta (-17.9%)
- Portland, OR (-16%)
- Fort Worth, TX (-11.2%)
- Nashville, TN (-8.6%)
Key Housing Market Data (for the four weeks ending January 21, 2023):
- The median sale price was $362,225, representing a 5.1% YoY change—the biggest increase since October 2022.
- The median asking price was $384,458, representing a 6.5% YoY change and also posting the biggest increase since October 2022.
- The median monthly mortgage payment was $2,525 at a 6.6% mortgage rate, representing a 10.7% YoY change. Payments were down roughly $200 from the all-time high set during the four weeks ending October 22, but up roughly $200 from the four weeks ending December 31.
- New listings were at 54,796, representing a 2.2% YoY change.
- Active listings were at 742,862, representing a -4% YoY change.
- The average months' supply of homes was 4.7 months, representing a +0.3 percentage point YoY change.
- The share of homes off the market in two weeks was 26.5%, remaining essentially unchanged YoY.
- Median days on market were 45, down -3 days YoY.
- The share of homes sold above the list price was 22.9%, up from 21% YoY.
- The share of homes with a price drop was approximately 4.4%, remaining essentially unchanged YoY.
- The average sale-to-list price ratio was 98.2%, representing a +0.4 percentage point change YoY.
Pending sales were 54,331 for the four weeks ending January 21, 2023, representing an -8.2 YoY change—the biggest decline in four months. Pending sales also increased in nine U.S. metros.

Metros with biggest YoY increases in pending sales:
- San Jose, CA (8.8%)
- Detroit (6.1%)
- Anaheim, CA (4.5%)
- Milwaukee (2.6%)
- San Francisco (2.3%)
Metros with biggest YoY decreases in pending sales:
- Portland, OR (-24.7%)
- New Brunswick, NJ (-21.9%)
- Newark, NJ (-18.9%)
- Houston (-18.3%)
- Atlanta (-17.3%)
“At the end of 2023, a lot of my clients said, ‘I’ll call you in January.’ And they did. This month has been nonstop,” said Shay Stein, a Redfin Premier agent in Las Vegas. “I wouldn’t say buyers are happy about 6.5% rates, but they’ll accept it because they’ll feel vindicated if rates rise back to 8%, and they can always refinance and avoid future bidding wars if rates drop further. And sellers are coming out of the woodwork, noticing the interest from buyers.”
To read the full report, including more data, charts, and methodology, click here [1].