 Post-crisis America has seen a spike in the number of renters—from 38.5 percent in 2006 up to 43.3 percent in 2014, nearly 5 percentage points—and the markets that have seen the largest increase in renters were those that were hit hardest by the foreclosure crisis, according to data released by Trulia [1] on Thursday.
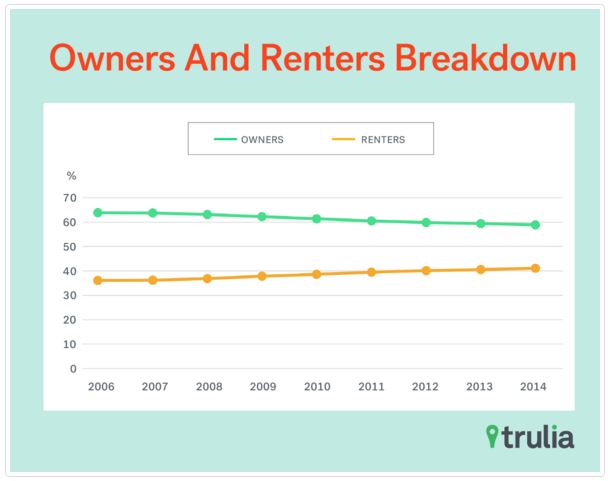
In a report titled “From Own to Rent: Who Lost the American Dream [1]?,” Trulia found that the share of renters in the 50 largest metros jumped from 36 percent in 2006 up to 41 percent in 2014.
“Each of the 50 largest metros that we examined in this study saw an increase in renters from 2006 to 2014,” wrote Trulia data scientist Mark Uh, the author of the report. “Many of these markets were hit hardest by foreclosures as homeowners became renters by circumstance.”
Las Vegas, which was one of the metros most affected by the foreclosure crisis, experienced a jump of nearly 10 percentage points in the share of renters from 2006 to 2014 (from 39.5 percent up to 49.4 percent), followed by Phoenix, Fort Lauderdale, West Palm Beach, and Tampa—four more metros where the foreclosure crisis hit hardest.
Meanwhile, housing markets that were not as deeply affected by the boom and bust have seen smaller increases in the share of renters. Those markets include Buffalo, Long Island, Hartford, and Boston, according to Trulia.
 But the share of renters is not the only thing increasing as renting has become more popular in the United States since the crisis—rents are also rising, and at the same time, incomes are falling. Trulia found that in the top 50 markets, average rents rose by 22.3 percent in the eight-year period while incomes declined by an average of 5.8 percent. The average household spent 29.7 percent of its income on rent in 2006, a number that rose to 31.5 percent in 2011 but subsequently fell back down to 30.7 percent in 2014.
Trulia found that the biggest shift from homeowner to renter occurred in the following demographics from 2006 to 2014:
- Older millennials (age 26 to 34);
- Men (three times more likely than women to move from owning to renting, despite the fact that the share of women who rent is still higher (44 percent compared to 38 percent);
- Hispanic households (the number of renters increased at twice the rate of whites, African-Americans, and Asians);
- Upper middle class and wealthy (a greater shift occurred among this group because lower income households were already renting at a higher rate);
- Everyone (the average rent rose by 22.3 percent in the top 50 markets, while the median income fell by 4.2 percent for the entire nation);
Click here [1] to see the entire report.