 Fannie Mae [1] and Freddie Mac [2] both experienced slight expansions for their mortgage portfolios to start of the year—but the winding down of the portfolios under the FHFA conservatorship is still on track because the values of the portfolios are down relative to where they were a year ago, according to a report from the Urban Institute [3] released Tuesday.
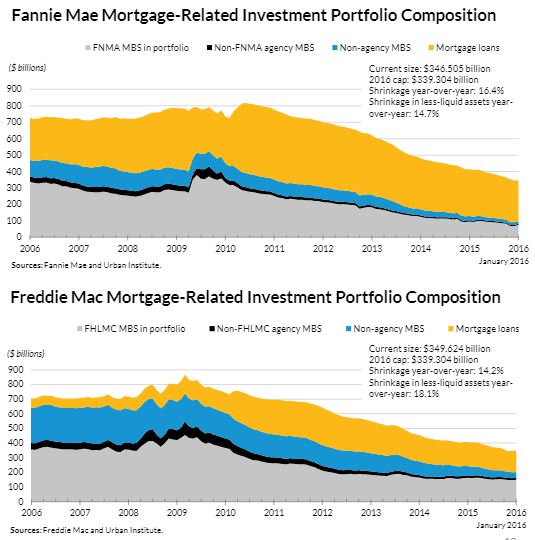
The Urban Institute’s Housing Finance at a Glance: March 2016 Chartbook [3] reported that the unpaid principal balance (UPB) in Fannie Mae’s mortgage portfolio, which totaled $346.5 billion at the end of January, was only slightly higher than the 2016 cap of $339.3 billion.
Likewise, the UPB in Freddie Mac’s mortgage portfolio as of the end of January, $349.6 billion, was only slightly higher than the 2016 cap.
“Both GSEs increased their portfolio slightly in January 2016; this should not be an issue as the GSEs are reasonably close to the year-end 2016 portfolio goal,” the report stated. “Relative to January 2015, Fannie Mae contracted by 16.4 percent, and Freddie Mac by 14.2 percent. They are shrinking their less liquid assets (mortgage loans and non-agency MBS) at close to the same pace that they are shrinking their entire portfolios.”
The less liquid assets for the Fannie Mae and Freddie Mac declined at a rates of 14.7 percent and 18.1 year-over-year in January, respectively.
In February, the mortgage portfolios returned to contraction for the GSEs after the slight upticks in January. For Freddie Mac, the mortgage-related investments portfolio contracted at an annualized rate of 10.1 percent over-the-month in February—computing to a monthly decline of about $3 billion, down to a balance of about $346.6 billion.
Fannie Mae’s gross mortgage portfolio contracted at an annual rate of 27.8 percent in February after January’s rare expansion. The February contraction translated to a month-over-month decline of more than $11 billion down to a value of about $337.2 billion by the end of February—below the 2016 cap of $339.3 billion.
Click here [3] to view the entire Chartbook.