 The decline in foreclosures and other default-related metrics has been steady over the five-plus years since the monthly total of completed foreclosures peaked at 117,782 in September 2010. March 2016’s total of completed foreclosures (36,000) was nearly 70 percent off of that peak total, according to CoreLogic’s March 2016 National Foreclosure Report [1] released Tuesday.
CoreLogic reported that the national foreclosure inventory rate for March 2016, which was 1.1 percent of all residential mortgages (about 427,000 homes), was the lowest since October 2007. Year-over-year, foreclosure inventory declined by 23 percent (from 1.4 percent and 556,000 homes) and has declined year-over-year now for 53 months in a row.
The number of mortgages in serious delinquency (90 days or more past due or in foreclosure or REO) for March 2016 was 1.2 million, or 3.1 percent—the lowest serious delinquency rate since November 2007.
What is really driving this lengthy, sustained decline in foreclosures? Why have completed foreclosures been falling since peaking nearly six years ago, and why are both foreclosure inventory and serious delinquencies at their lowest levels since before the crisis?
A number of factors have resulted in the decline. A main driver has been tighter underwriting and lending standards that have resulted in higher quality loans being made, and which has in turn resulted in fewer defaults. Home price appreciation, which has also approached or surpassed pre-crisis levels in many areas, has also played a role.
“Delinquencies and foreclosure rates are now at pre-crash levels as the benefits of higher home prices, improving economic fundamentals and years of cautious underwriting are being felt across the country,” said Anand Nallathambi, president and CEO of CoreLogic. “Longer term, as loans made since 2009 account for a larger share of outstanding debt, we anticipate that the serious delinquency rate will have further substantive declines.”
Economic improvements have also been partially responsible for the sustained foreclosure decline over the past few years.
“Nationally, the economy added 609,000 jobs during the first three months of 2016, and average weekly earnings grew 2 percent over the past year,” said Dr. Frank Nothaft, chief economist for CoreLogic. “Job and earnings growth have helped bring serious delinquency rates down in nearly every state. However, serious delinquency rates increased in North Dakota and West Virginia, two states affected by the drop in demand for the fuel each produces.”
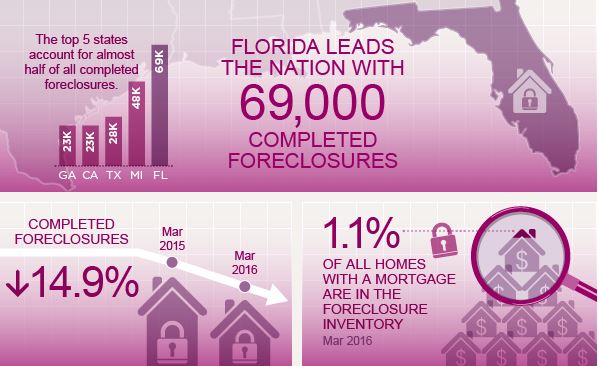
While foreclosure inventory and serious delinquencies are below pre-crisis levels, completed foreclosures have a long way to go. March’s total of completed foreclosures represented a decline of 6,000 over-the-year from March 2015’s total of 42,000. By comparison, the monthly pre-crisis average was about 21,000 from 2000 to 2006.
Completed foreclosures represent the true number of homes lost to foreclosure. Since the crisis began in September 2008, approximately 6.2 million homes have been lost to foreclosure. Since Q2 2004 when homeownership rates peaked, approximately 8.2 million homes have been lost.