
 DSNews The homepage of the servicing industry


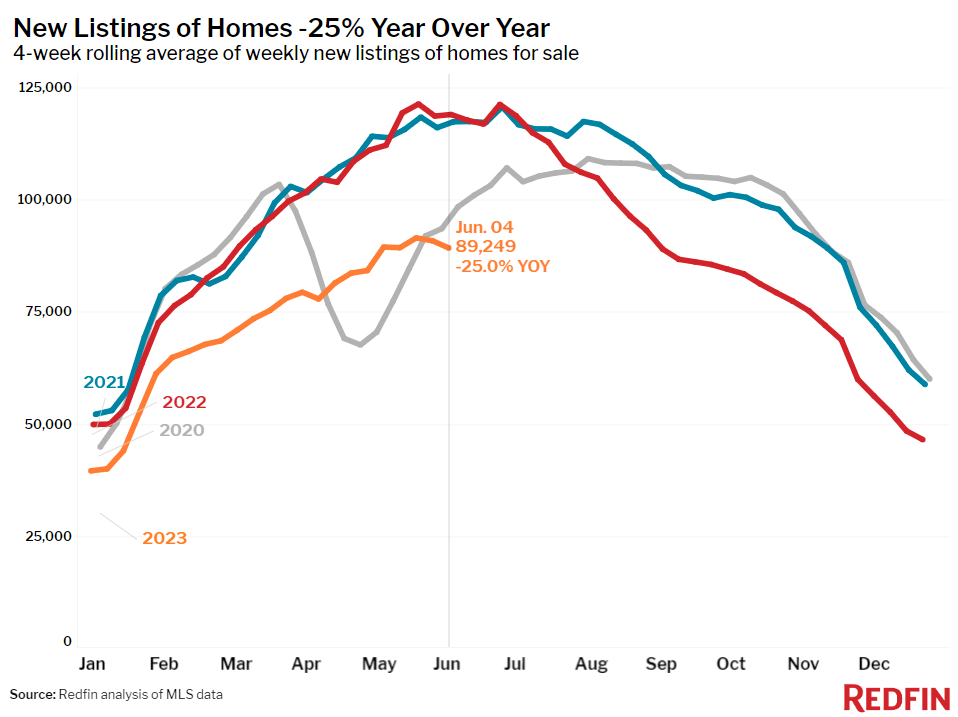
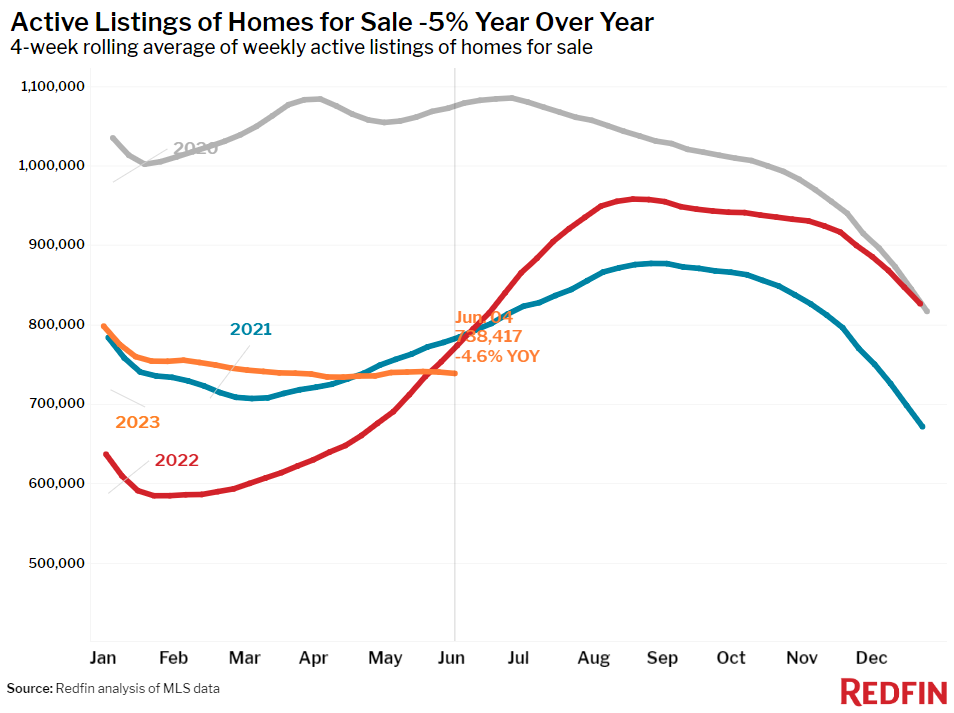
As home prices and interest rates remain elevated, limiting overall home sales nationwide, new listings of homes for sale fell 25% year-over-year to their lowest level of any early June on record, according to a new report from Redfin. New findings revealed the continued lack of new listings has pushed the total number of homes on the market down 5% year-over-year.
High mortgage rates are driving the inventory shortage, with the daily average hitting 6.94% on June 7, near its highest level in two decades. The vast majority of homeowners have a mortgage rate below 6%, discouraging them from listing their home and giving up their relatively low rate.
Limited inventory is keeping national home-price declines relatively modest, with the typical U.S. home price down 1.6% year-over-year. That’s the smallest dip in three months and half the size of April’s 3.2% drop, which was the biggest in at least a decade.
While home prices are still increasing in some parts of the country, the median U.S. asking price is unchanged from a year ago after several weeks of declines, indicating that home sellers in at least some metro areas are noticing that they can command favorable prices.
Leading indicators of homebuying activity:
- For the week ending June 1, the average 30-year fixed mortgage rate was 6.79%, up from 6.57% the week before–that’s the biggest weekly increase since October. It’s also the highest rate since November.
- Mortgage-purchase applications during the week ending June 2 decreased 2% from a week earlier, seasonally adjusted. Purchase applications were down 27% from a year earlier.
- The seasonally adjusted Redfin Homebuyer Demand Index was up slightly from a week earlier during the week ending June 4. It was up 3% from a year earlier, marking just the second annual increase in over a year. Demand was dropping at this time in 2022 as mortgage rates rose.
- Google searches for “homes for sale” were up 7% from a month earlier during the week ending June 3, and essentially flat from a year earlier.
In addition to inflating prices, the scarcity of listings is limiting purchases. Pending home sales are now down 17%, continuing a yearlong streak of double-digit drops. But early-stage homebuying demand continues to hold up, with Redfin’s Homebuyer Demand Index near its highest level in a year. That indicates that would-be homebuyers are out there and may make an offer when mortgage rates decline and/or more homes are listed.
“Homes priced under $500,000 are flying off the market because buyers in that price range don’t have many options,” said Sacramento Redfin Premier agent David Orr. “I've been working with one first-time homebuyer for about a year, and she’s adjusted her search as rates have risen. Now that mortgage rates are close to 7%, she’s looking at lower-priced, smaller homes. But the problem we’re facing now is competition: In that lower price range, it takes many misses before you get a hit. She just made an offer nearly $30,000 above asking price for a home listed at $429,000, but she lost out because it had four other offers. I’m advising buyers to get their loan pre-approved and look at homes under budget so they’re prepared to go above asking price.”
Key housing market takeaways for 400+ U.S. metro areas:
- The median home sale price was $379,463, down 1.6% from a year earlier, the smallest decline in three months. Price declines have been shrinking for the last six weeks.
- Home-sale prices declined in 29 metros, with the biggest drops in Austin, TX (-13.4% YoY), Oakland, CA (-11.9%), Las Vegas (-9%), San Francisco (-8.7%), and Phoenix (-7.9%).
- Sale prices increased most in Cincinnati (9.2%), Miami (8%), Milwaukee (8%), Fort Lauderdale, FL (5.8%), and Virginia Beach, VA (4.8%).
- The median asking price of newly listed homes was $397,475, unchanged from a year earlier.
- The monthly mortgage payment on the median-asking-price home hit a new record high of $2,651 at a 6.79% mortgage rate, the average for the week ending June 1. That’s up 14% ($320) from a year earlier.
- Pending home sales were down 16.6% year-over-year, on par with declines over the last month.
- Pending home sales fell in all metros Redfin analyzed. They declined most in Seattle (-31.7% YoY), Milwaukee (-29.5%), San Diego (-28.4%), Portland, OR (-27.7%), and Providence, RI (-26.7%).
- New listings of homes for sale fell 25% year-over-year, one of the biggest declines since May 2020.
- New listings declined in all metros Redfin analyzed. They fell most in Las Vegas (-42.3% YoY), Phoenix (-40.9%), Seattle (-40.4%), Oakland (-39.8%), and San Diego (-37.2%).
- Active listings (the number of homes listed for sale at any point during the period) dropped 4.6% from a year earlier, marking just the second decline in 12 months. The first was a week earlier, when active listings declined 1.7%. Active listings also inched down from a month earlier; typically, they post month-over-month increases at this time of year.
- Months of supply—a measure of the balance between supply and demand, calculated by the number of months it would take for the current inventory to sell at the current sales pace—was 2.6 months, up from 2.1 months a year earlier. Four to five months of supply is considered balanced, with a lower number indicating seller’s market conditions.
- 33.5% of homes that went under contract had an accepted offer within the first two weeks on the market, down from 38% a year earlier.
- Homes that sold were on the market for a median of 28 days, the shortest span since September. That’s up from a record low of 18 days a year earlier.
- 35.2% of homes sold above their final list price. That’s the highest share since September but is down from 54% a year earlier.
- On average, 5.2% of homes for sale each week had a price drop, up from 3.9% a year earlier.
- The average sale-to-list price ratio, which measures how close homes are selling to their final asking prices, was 99.8%. That’s the highest level since August but is down from 102.4% a year earlier.
Although home sales remain limited, many buyers are still touring homes. Touring activity as of June 4 was up 16% from the start of the year, compared with a 2% decline at the same time last year, according to ShowingTime. Tours declined during this time last year as mortgage rates surged nationwide.
To read the full report, including more data, charts and methodology, click here.


