
 DSNews The homepage of the servicing industry


 In May, the HouseCanary Market Pulse reported the first signs of a potential softening in the housing market as a litany of external influences exerted pressure on the housing market. A challenging environment for weary homebuyers exists today as increasing rates, already bloated prices, and short supply has made homeownership more expensive.
Concurrently, price growth has slowed compared to February 2022 through April 2022, and listing under contract experienced a double-digit decrease year-over-year, an indicator that market activity may be slowing as we head into the summer busy season.
HouseCanary predicts that over the next few months, short supply will be an ongoing problem which will occur amid an environment of single-digit price growth.
“In May, we saw the first sign of a potential softening in the housing market as mortgage rates are climbing higher than pre-pandemic levels,” said Jeremy Sicklick, Co-Founder and CEO of HouseCanary. “It continues to be a challenging environment for buyers, as increased rates, already bloated prices, and short supply leading to competitive bidding has made homeownership more expensive.”
“At the same time, price growth has slowed compared to February through April of this year and listings under contract experienced a double-digit decrease year-over-year, indicating slowing market activity may be cooling as we head into the summer months. Even so, pent up demand still exists in the market currently. Over the next few months, we expect to continue to experience short supply and low single digit price growth.”
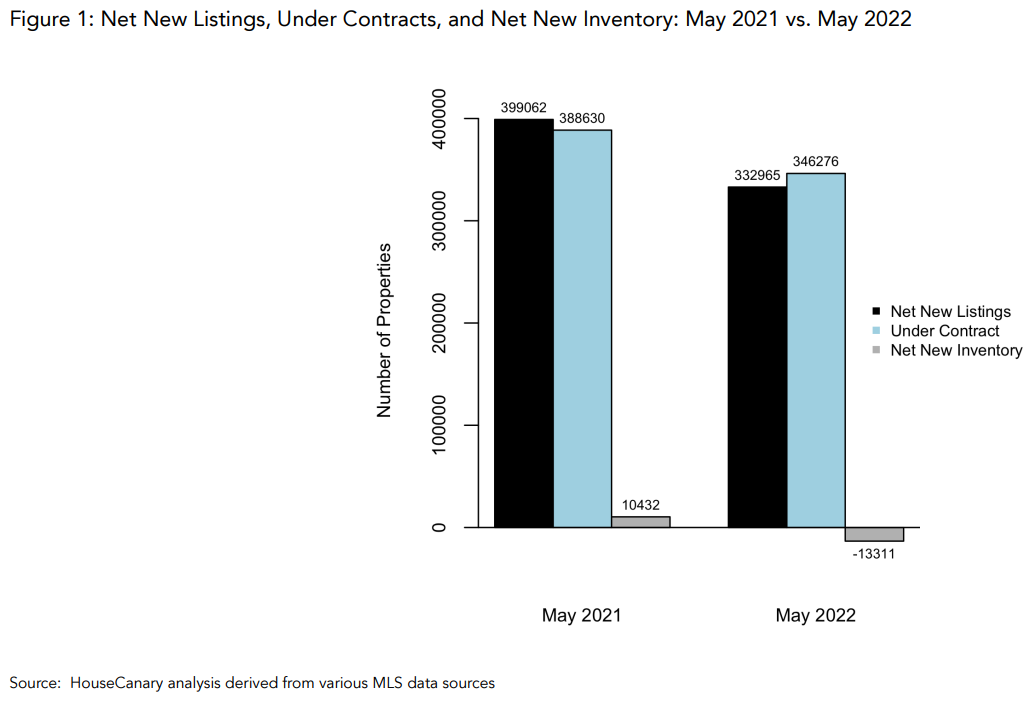
Breaking down the HouseCanary's Market Pulse report for the month of May, there were 332,965 new listings placed on the market. This represents a 16.6% decrease versus May 2021.
Over the last 52 weeks, the number of net new listings placed on the market was 3,150,503, a 4.2% decrease versus the 3,287,729 seen over the year prior.

Total Net New Listings:
- Since May 2021, there have been 3,150,503 net new listings placed on the market, which is a 4.2% decrease versus the 52 weeks prior
- Percentage of total net new listings over the last 52 weeks, broken down by home price:
- $0-$200k: 15.7%
- $200k-$400k: 38.5%
- $400k-$600k: 23.0%
- $600k-$1mm: 15.3%
- >$1mm: 7.5%
- Percent change in net new listing activity over the last 52 weeks versus the same period in 2021, broken down by home price:
- $0-$200k: (-23.4%)
- $200k-$400k: (-13.4%)
- $400k-$600k: +13.9%
- $600k-$1mm: +20.9%
- >$1mm: +14.6%
Monthly Net New Listing Volume (Single-Family Detached Homes):
- Monthly new listing volume was down 11.6% compared to May 2021
- In May, there were 332,965 net new listings placed on the market, representing a 16.6% decrease year-over-year
- For the month of May, the percent change in net new listing volume compared to May 2021, broken down by home price:
- $0-$200k: (-27.4%)
- $200k-$400k: (-26.9%)
- $400k-$600k: (-8.7%)
- $600k-$1mm: (-0.4%)
- >$1mm: +5.4%
Listings Under Contract:
- Over the last 52 weeks, 3,336,319 properties have gone into contract, representing an 8.3% decrease relative to the same period in 2021
- Percentage of total contract volume since May 2021, broken down by home price:
- $0-$200k: 16.4%
- $200k-$400k: 39.1%
- $400k-$600k: 22.5%
- $600k-$1mm: 14.7%
- >$1mm: 7.3%
- Percent change in contract volume over the last 52 weeks versus the same period in 2021, broken down by home price:
- $0-$200k: (-24.0%)
- $200k-$400k: (-16.4%)
- $400k-$600k: +7.3%
- $600k-$1mm: +13.8%
- >$1mm: +7.5%
Monthly Contract Volume (Single-Family Detached Homes):
- For the month of May, there were 346,276 listings that went under contract nationwide, which is a 10.9% decrease year-over-year
- For the month of May, the percent change in contract volume compared to May 2021, broken down by home price:
- $0-$200k: (-15.7%)
- $200k-$400k: (-18.8%)
- $400k-$600k: (-2.1%)
- $600k-$1mm: +1.4%
- >$1mm: (-7.6%)
Median Listing Price Activity (Single-Family Detached Homes):
- For the week ending May 27, 2022, the median price of all single-family listings in the U.S. was $438,263, a 12.7% increase year-over-year
- For the week ending May 27, 2022, the median closed price of single-family listings in the U.S. was $430,934, a 14.4% increase year-over-year
- The median price of all single-family listings in the U.S. is up by 1.1% month-over-month and the median price of closed listings has increased by 1.8% month-over-month
Click here to view the report in its entirety.


