
 DSNews The homepage of the servicing industry


According to new research from LendingTree, home prices have risen significantly over the past two years, and paying $1 million or more for a house seems excessive as well as unattainable to most Americans. However, just because million-dollar homes aren’t common throughout the U.S. doesn’t mean they aren’t prevalent in some areas.
To see where million-dollar houses are most common, LendingTree analyzed data from the U.S. Census Bureau’s 2020 American Community Survey to look at the share of million-dollar homes in each of the nation’s 50 largest metropolitan areas. While million-dollar homes aren’t prevalent in most of the nation’s largest metros, they do make up a large share of homes in some notoriously high-cost areas like San Jose and San Francisco, California.
Key findings
- Million-dollar homes are relatively uncommon in most of the country. An average of only 4.71% of the owner-occupied homes in the nation’s 50 largest metros are valued at $1 million or more.
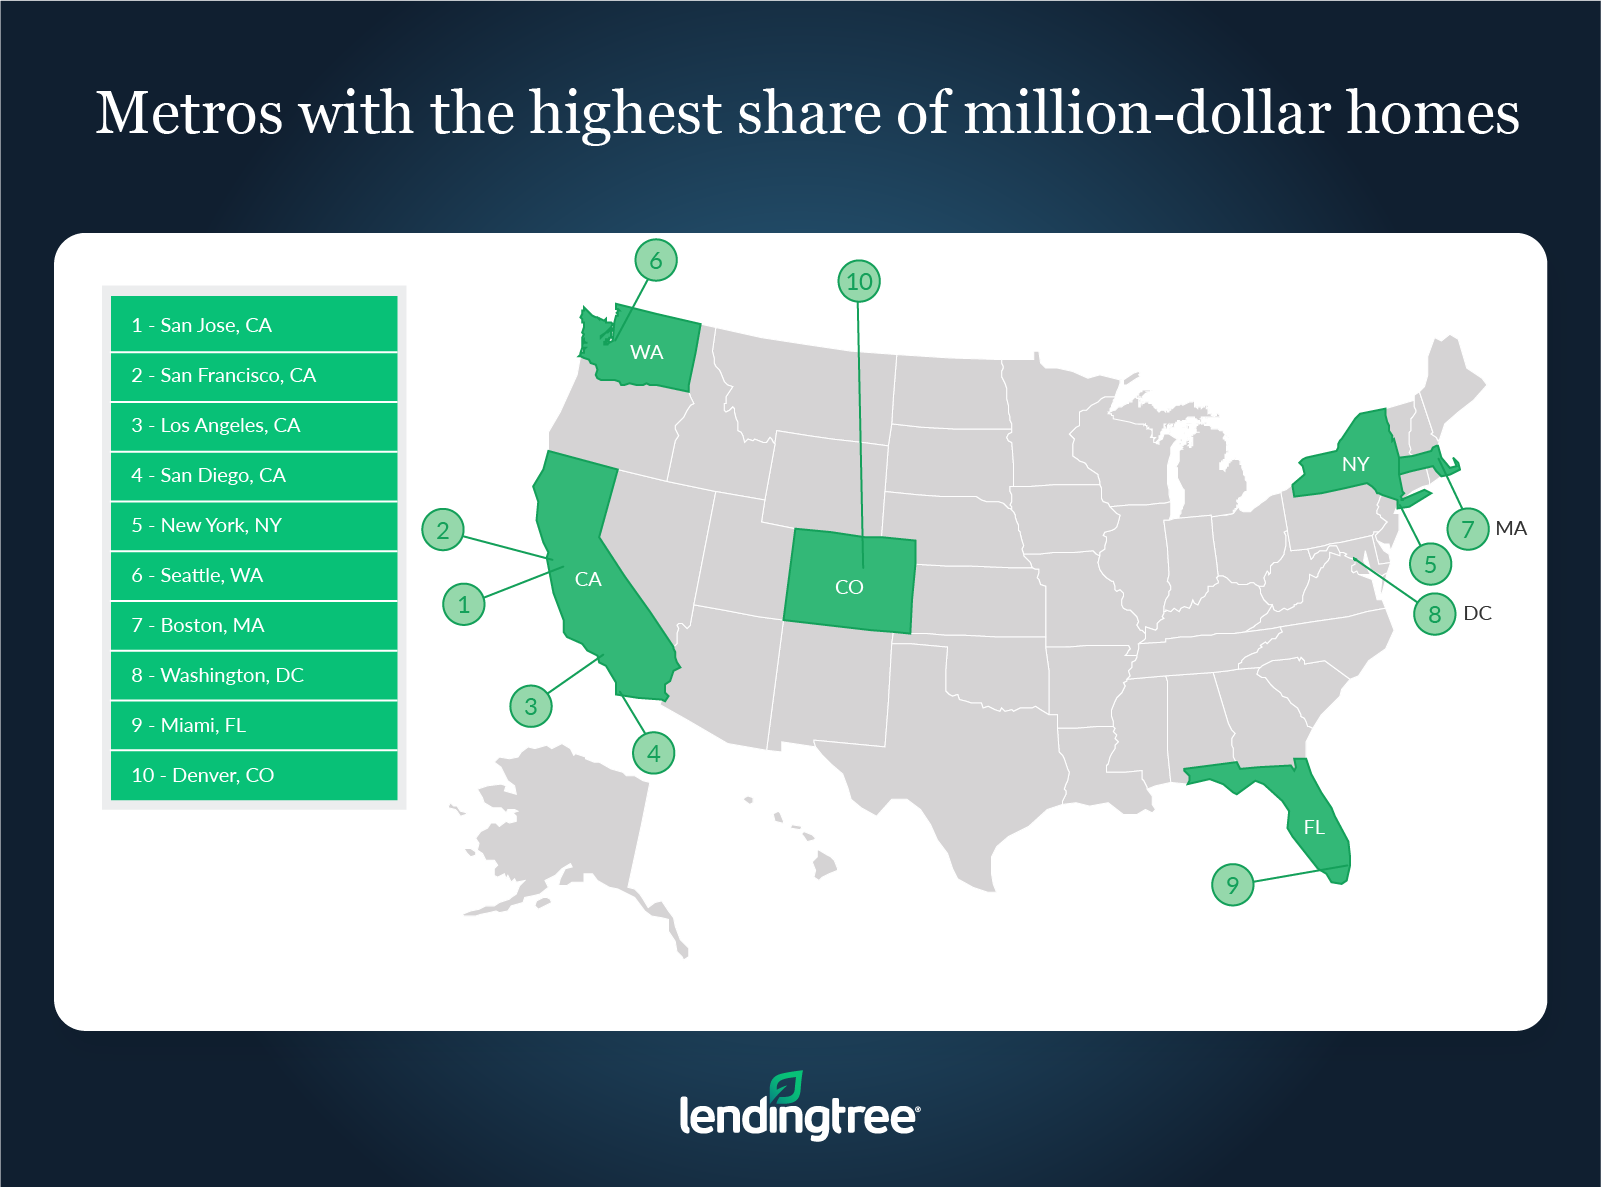
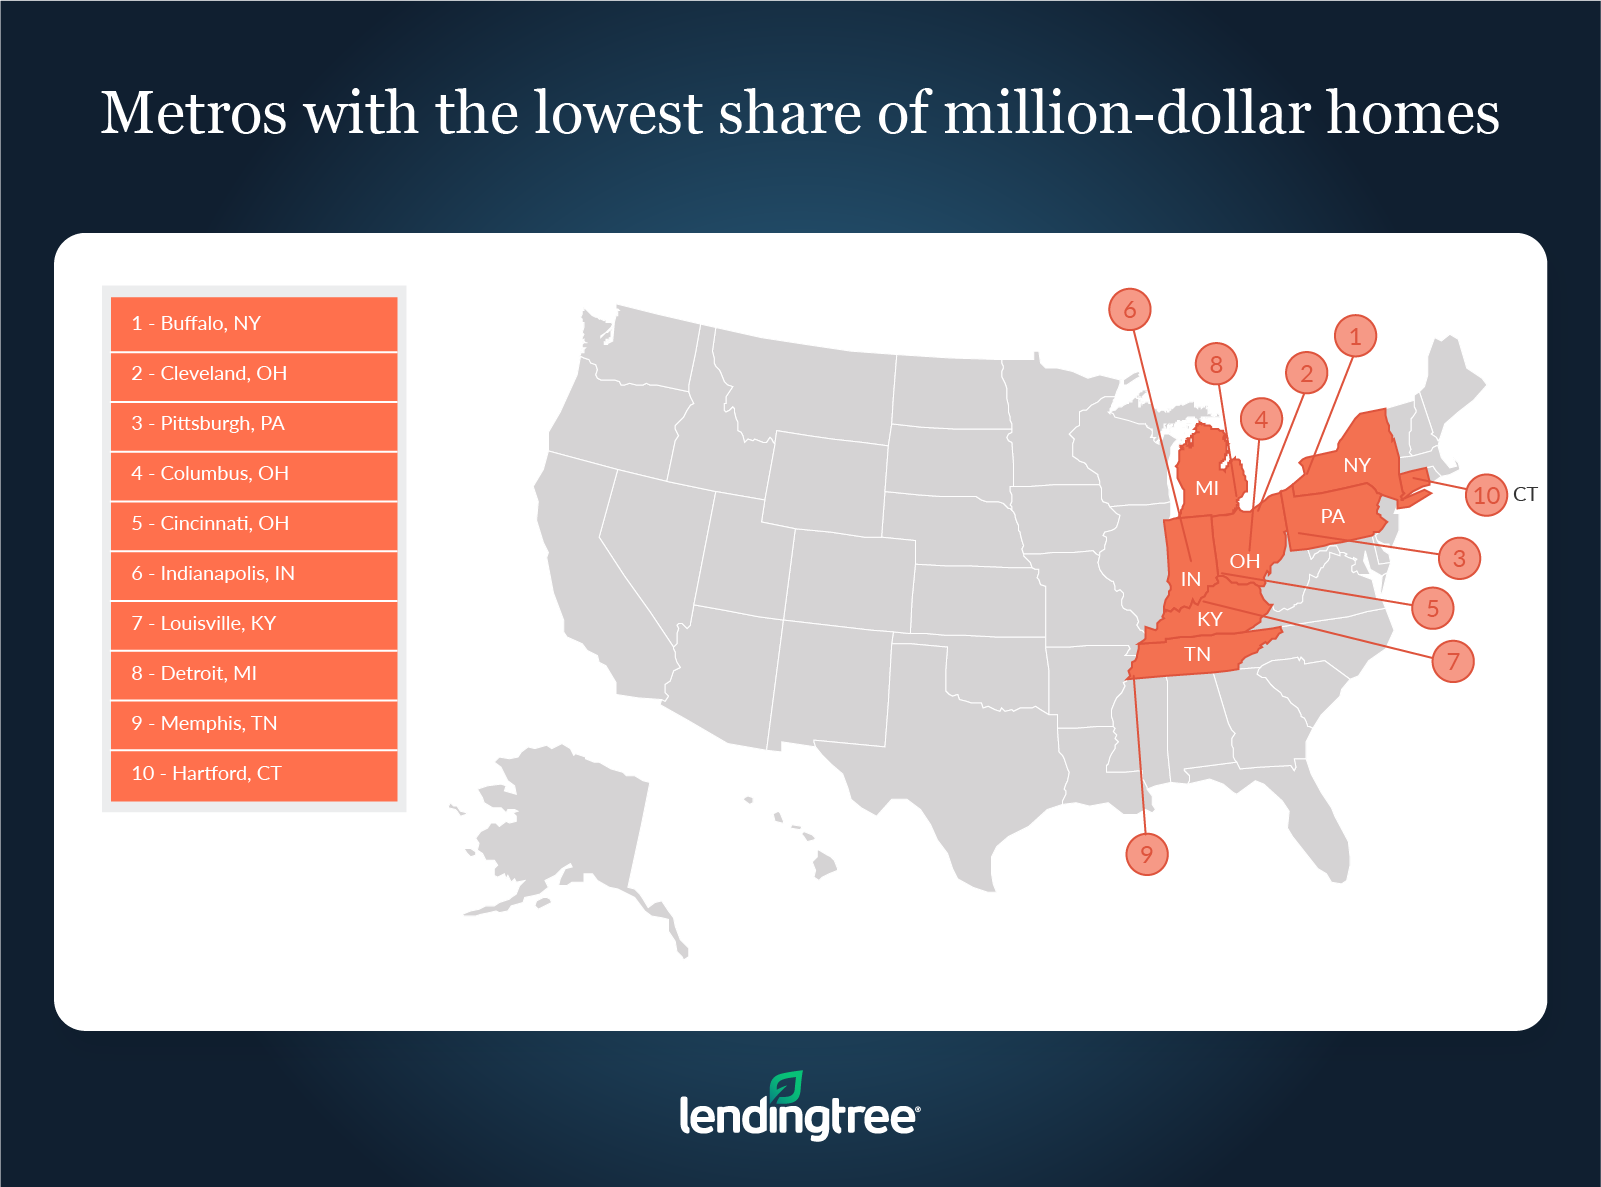
- The prevalence of million-dollar homes can vary significantly by metro. For example, 52.89% of owner-occupied homes are valued at $1 million or more in San Jose, California, making it the only one of the nation’s 50 largest metros where a majority of owner-occupied homes are worth at least $1 million. In the metro with the smallest share of $1 million homes, Buffalo, New York, that figure is 0.56%.
- Of the 10 metros with the largest share of million-dollar homes, the four with the highest percentage of million-dollar homes are in California. Driven by factors including dense populations and the significant wealth generated by the tech and entertainment industries, an average of 31.33% of owner-occupied homes across San Jose, San Francisco, Los Angeles and San Diego are valued at at least $1 million.
- Buffalo, N.Y., Cleveland and Pittsburgh have the smallest share of homes valued at $1 million or more. An average of only 0.61% of owner-occupied homes in these generally affordable metros are worth $1 million or more.
1. San Jose, Calif.
- Number of owner-occupied housing units: 370,241
- Number of owner-occupied units valued at $1 million or more: 195,822
- Percentage of owner-occupied units valued at $1 million or more: 52.89%
- Median value of owner-occupied housing units: $1,041,800
2. San Francisco
- Number of owner-occupied housing units: 935,620
- Number of owner-occupied units valued at $1 million or more: 377,736
- Percentage of owner-occupied units valued at $1 million or more: 40.37%
- Median value of owner-occupied housing units: $888,500
3. Los Angeles
- Number of owner-occupied housing units: 2,129,700
- Number of owner-occupied units valued at $1 million or more: 395,035
- Percentage of owner-occupied units valued at $1 million or more: 18.55%
- Median value of owner-occupied housing units: $641,300
1. Buffalo, New York
- Number of owner-occupied housing units: 319,246
- Number of owner-occupied units valued at $1 million or more: 1,802
- Percentage of owner-occupied units valued at $1 million or more: 0.56%
- Median value of owner-occupied housing units: $155,800
2. Cleveland
- Number of owner-occupied housing units: 563,145
- Number of owner-occupied units valued at $1 million or more: 3,297
- Percentage of owner-occupied units valued at $1 million or more: 0.59%
- Median value of owner-occupied housing units: $156,200
3. Pittsburgh
- Number of owner-occupied housing units: 708,073
- Number of owner-occupied units valued at $1 million or more: 4,736
- Percentage of owner-occupied units valued at $1 million or more: 0.67%
- Median value of owner-occupied housing units: $159,800
Since the start of the year, mortgage rates have risen drastically. These higher rates have made buying homes more expensive, even in areas where home prices haven’t necessarily increased.
With that said, because different lenders can offer different rates to the same person, it’s often possible for borrowers to find a lower rate on their mortgage by shopping around for a lender before buying.
Though these savings aren’t exclusive to those looking to buy million-dollar homes, higher-cost borrowers are likely to see larger savings the lower the rate they get. As a result, if you’re planning on buying in a high-cost area, one of the best ways you can save money is by shopping for a mortgage before buying.
To read the full analysis, including more charts and methodology, click here.


