
 DSNews The homepage of the servicing industry


 Black Knight Inc. has released a “first look” the latest iteration of its Mortgage Monitor Report for June 2022, which looks at delinquency and foreclosure rates across the U.S.
According to Black Knight, the national delinquency rate rose to 2.84% in June, ending a downward trend that has materialized over the last few months. The delinquency rate was 2.75% in May, 2.80% in April, and 2.84% in March.
Looking specifically at foreclosure starts, this metric was up 26.6% in June on a monthly basis, but up 440.91% year-over-year. Starts also represented the highest share (4%) of serious delinquencies since March 2020, but less than half the rate in the years leading up to the pandemic.
In addition, active foreclosure inventory rose by 16,000 units as volumes continue to slowly come off the record lows brought on by the pandemic moratoriums and forbearance programs.
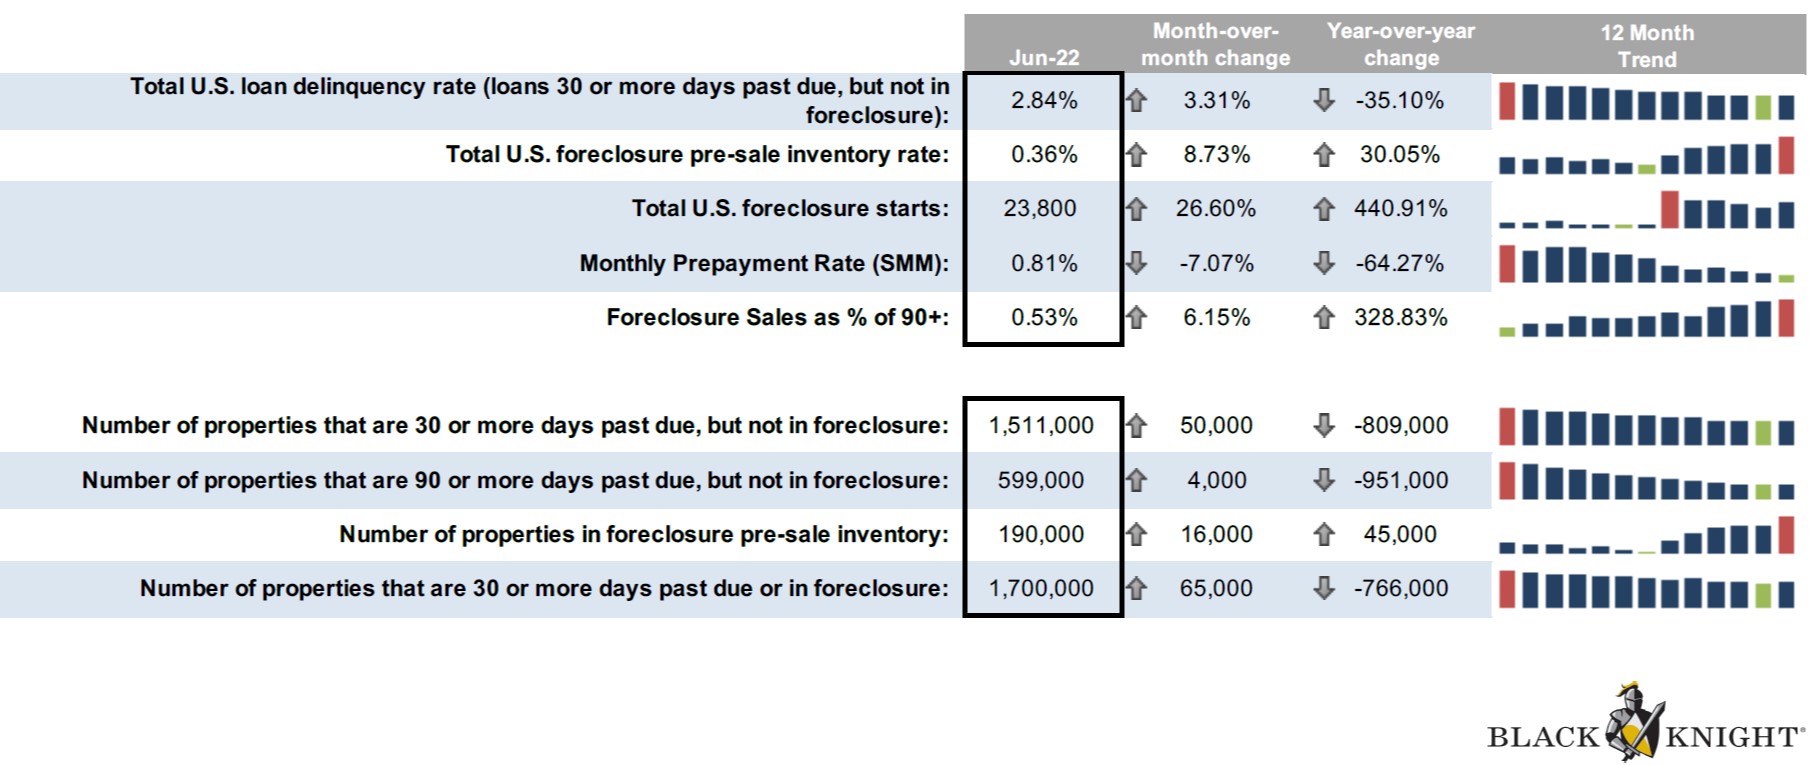
Notable statistics from the report include:
Total U.S. loan delinquency rate (loans 30 or more days past due, but not in foreclosure): 2.84%
- Month-over-month change: 3.31%
- Year-over-year change: -35.10%
Total U.S. foreclosure pre-sale inventory rate: 0.36%
- Month-over-month change: 8.73%
- Year-over-year change: 30.05%
Total U.S. foreclosure starts: 23,800
- Month-over-month change: 26.60%
- Year-over-year change: 440.91%
Monthly prepayment rate (SMM): 0.81%
- Month-over-month change: -7.07%
- Year-over-year change: -64.27%
Foreclosure sales as % of 90+: 0.53%
- Month-over-month change: 6.15%
- Year-over-year change: 328.83%
Number of properties that are 30 or more days past due, but not in foreclosure: 1,511,000
- Month-over-month change: 50,000
- Year-over-year change: -809,000
Number of properties that are 90 or more days past due, but not in foreclosure: 599,000
- Month-over-month change: 4,000
- Year-over-year change: -951,000
Number of properties in foreclosure pre-sale inventory: 190,000
- Month-over-month change: 16,000
- Year-over-year change: 45,000
Number of properties that are 30 or more days past due or in foreclosure: 1,700,000
- Month-over-month change: 65,000
- Year-over-year change: -766,000
Top 5 States by Non-Current Percentage:
- Mississippi: 6.41%
- Louisiana: 5.65%
- Alabama: 4.72%
- Oklahoma: 4.69%
- West Virginia: 4.68%
Bottom 5 States by Non-Current Percentage:
- Utah: 1.95%
- Colorado: 1.86%
- California: 1.80%
- Washington: 1.66%
- Idaho: 1.66%
Top 5 States by 90+ Days Delinquent Percentage:
- Mississippi: 2.43%
- Louisiana: 2.11%
- Alabama: 1.77%
- Alaska: 1.62%
- Maryland: 1.59%
Top 5 States by 6-Month Change in Non-Current Percentage
- District of Columbia: 21.83%
- Hawaii: 21.82%
- Nevada: 20.56%
- Louisiana: 19.99%
- Washington: 18.38%
Bottom 5 States by 6-Month in Non-Current* Percentage:
- North Dakota: 1.91%
- Iowa: -2.50%
- Maine: -3.20%
- Kansas: -4.71%
- Missouri: -5.00%
Click here to see the data in its entirety.


