
 DSNews The homepage of the servicing industry


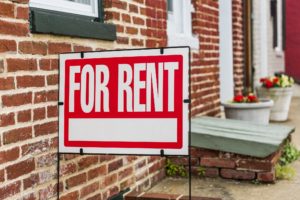 When Covid-19 lockdowns began last year, single-family rental prices slowed to stagnant. But as the the price of real estate appreciated at staggering rates over the past year, rent price growth recovered and now has "sped past what their levels are projected to have been based on pre-pandemic trend," according to Zillow's latest market report. Researchers there call it "a milestone in the strong rental market recovery."
Home prices continue to break records but show some signs of stabilization.
The average monthly rent price nationally hit $1,843 in July, surpassing June's record appreciation and rising 9.2%, or $156, above July 2020.
"With the economy continuing to reopen, employees receiving more long-term guidance on remote work, and as students find their way back to college campuses, the rental market is picking back up," said Nicole Bachaud, Zillow Economic Data Analyst. "As high demand puts pressure on rents and incomes are unable to keep up, affordability will become more of a challenge in the coming months."
Zillow estimates rents are now $52 higher than they would have been if the past 18 months had been more normal. Rents first surpassed their pre-pandemic trajectory last month, Bachaud added.
Rents in nine major metropolitan areas, all across the Sun Belt, are at least 10% higher than would have been expected based on pre-pandemic trends, topping out at 15.6% higher in Tampa. Rents in just nine metros are lower than projected, and nearly all are expensive coastal markets: Los Angeles; Washington, D.C.; Chicago; Minneapolis; Seattle; Boston; New York; San Francisco; and San Jose.
The top 14 metros for annual rent growth are scattered across the Sun Belt, led by Phoenix, up 23.1%, Las Vegas (22.7%), Tampa (21.4%), and Riverside (19.9%). July rents are also positive year over year in all major metros, with holdouts New York, San Francisco and San Jose finally posting yearly growth.
For-sale inventory rose 4.5% from June too July, marking the third consecutive month of rising supply.
Home value growth again broke monthly and annual records, with year-over-year appreciation of 16.7% and monthly gains of 2%. This brings typical home values measured by Zillow's Home Value Index (ZHVI) to $298,933, up nearly $43,000 over last July. The end of rampant price hikes may be on the horizon, however, as 22 of the nation's 50 largest metros had slower monthly growth than in June, according to Zillow.
"All signs point to the likelihood that the housing market is beginning to ease off the gas pedal," said Bachaud.
Some experts have pointed out that as renting becomes less affordable, homeownership could begin to appeal to more young adults. As Zillow Researcher Manny Garcia reported months ago, "homeownership still appears to be a priority and aspiration among those sometimes called the rent forever generation," referring to a Business Insider article on millennials opting out of homeownership.
|
Metropolitan |
Zillow Home (ZHVI) |
ZHVI – |
Zillow (ZORI) |
ZORI – |
ZORI – |
Inventory – |
|
United States |
$298,933 |
16.7% |
$1,843 |
9.2% |
1.9% |
4.5% |
|
New York, NY |
$552,607 |
13.3% |
$2,671 |
1.7% |
2.3% |
2.4% |
|
Los Angeles–Long Beach–Anaheim, CA |
$831,593 |
19.3% |
$2,553 |
6.9% |
1.7% |
2.8% |
|
Chicago, IL |
$280,130 |
13.4% |
$1,746 |
3.5% |
1.0% |
5.4% |
|
Dallas–Fort Worth, TX |
$313,393 |
19.4% |
$1,642 |
12.4% |
2.4% |
4.5% |
|
Philadelphia, PA |
$302,822 |
16.9% |
$1,710 |
6.1% |
1.0% |
4.8% |
|
Houston, TX |
$258,174 |
15.0% |
$1,504 |
8.8% |
1.9% |
3.3% |
|
Washington, D.C. |
$512,936 |
14.2% |
$2,107 |
3.8% |
1.6% |
5.3% |
|
Miami–Fort Lauderdale, FL |
$355,793 |
14.7% |
$2,249 |
17.1% |
3.2% |
-4.0% |
|
Atlanta, GA |
$301,104 |
19.6% |
$1,787 |
17.6% |
2.9% |
2.5% |
|
Boston, MA |
$592,940 |
16.7% |
$2,557 |
2.7% |
1.1% |
-0.3% |
|
San Francisco, CA |
$1,324,433 |
17.8% |
$3,082 |
0.9% |
1.6% |
3.4% |
|
Detroit, MI |
$220,309 |
17.8% |
$1,387 |
10.5% |
1.5% |
10.2% |
|
Riverside, CA |
$495,619 |
25.1% |
$2,358 |
19.9% |
2.5% |
6.0% |
|
Phoenix, AZ |
$390,733 |
29.8% |
$1,746 |
23.1% |
3.2% |
1.6% |
|
Seattle, WA |
$670,473 |
22.7% |
$2,125 |
6.2% |
2.4% |
4.6% |
|
Minneapolis–St. Paul, MN |
$347,512 |
14.0% |
$1,605 |
4.1% |
0.6% |
6.3% |
|
San Diego, CA |
$792,531 |
26.0% |
$2,577 |
11.9% |
2.3% |
5.7% |
|
St. Louis, MO |
$216,727 |
15.9% |
$1,224 |
8.1% |
1.4% |
4.9% |
|
Tampa, FL |
$295,532 |
23.7% |
$1,819 |
21.4% |
3.8% |
2.4% |
|
Baltimore, MD |
$345,194 |
13.8% |
$1,749 |
9.9% |
1.8% |
6.0% |
|
Denver, CO |
$554,544 |
20.4% |
$1,872 |
10.2% |
2.2% |
8.1% |
|
Pittsburgh, PA |
$196,897 |
19.1% |
$1,247 |
4.8% |
0.1% |
7.1% |
|
Portland, OR |
$515,049 |
19.1% |
$1,753 |
8.9% |
1.7% |
6.5% |
|
Charlotte, NC |
$303,816 |
20.5% |
$1,628 |
13.6% |
2.1% |
4.9% |
|
Sacramento, CA |
$540,438 |
23.6% |
$2,142 |
14.2% |
2.6% |
|
|
San Antonio, TX |
$250,108 |
17.0% |
$1,344 |
11.0% |
2.7% |
1.6% |
The full market report is available at Zillow.com.
Investors in build-to-rent communities and homes, as well as all single-family rental investors, are encouraged to attend this fall's Single-Family Rental and Investment Roundtable, part of 2021 Five Star Conference and Expo, September 19-21 at the Hyatt Regency Hotel in Dallas, Texas.


