 HouseCanary, Inc [1]. has released its latest monthly Market Pulse report [2], covering 22 listing-derived metrics and comparing data between August 2021 and August 2022, which found that the housing market cooldown that appeared earlier this year continued into the traditional end of summer, and predicts further cooling through the fall.
“The nationwide supply shortage accelerated by the Fed’s rate hikes and economic concerns persisted through the end of the summer despite a slight increase in inventory back in June,” said Jeremy Sicklick [3], HouseCanary’s Co-Founder and CEO. “Decelerating price growth, decreasing sale-to-list ratio, and an increase in median days on market are all indicators of a potential market normalization as both buyer and seller activity continue to cooldown. More and more would-be buyers are holding off on making offers as raised rates amplify perceptions of unaffordability.”
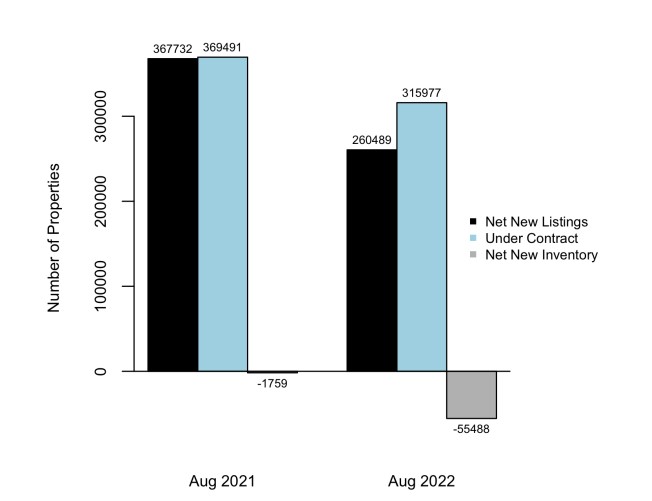
According to the report, there were 260,489 new listings placed on the market which represents a 29.2% decrease compared to the same period last year.
Over the last year, there have been 2.23 million new listings placed on the market representing a 6.4% year-over-year decrease.
“In response to the decreased demand, sellers are cutting listing prices or dropping out of the market completely, suggesting we may see the market shift in buyers’ favor as we head into the fall,” said Sicklick.
Top-level data from the report includes:
- Since August 2021, there have been 3,226,813 net new listings placed on the market, which is a 6.4% decrease compared to the 52 weeks prior.
- The volume of price drops increased 95.5% compared to the same period last year.
- Monthly nationwide supply continues to trend downward on the heels of elevated interest rates and market seasonality.
- Net new listing volume and contract volume are down across every price bin on a year-over-year basis.
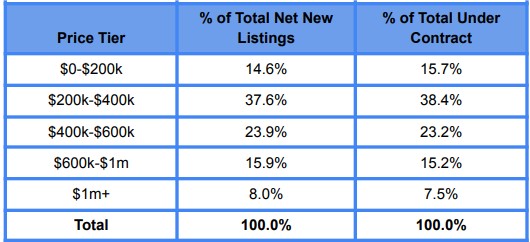
Percentage of total net new listings over the last 52 weeks, broken down by home price:
- $0-$200k: 14.6%
- $200k-$400k: 37.6%
- $400k-$600k: 23.9%
- $600k-$1mm: 15.9%
- >$1mm: 8.0%
Percent change in net new listing activity over the last 52 weeks versus the same period in 2021, broken down by home price:
- $0-$200k: -25.4%
- $200k-$400k: -15.3%
- $400k-$600k: +9.5%
- $600k-$1mm: +14.5%
- >$1mm: +12.2%
Monthly Net New Listing Volume (Single-Family Detached Homes):
- Monthly new listing volume was down 18.7% compared to August 2021
- In August, there were 260,489 net new listings placed on the market, representing a 29.2% decrease year-over-year.
For the month of August, the percent change in net new listing volume compared to August 2021, broken down by home price:
- $0-$200k: -35.4%
- $200k-$400k: -31.9%
- $400k-$600k: -23.6%
- $600k-$1mm: -22.8%
- >$1mm: -25.9%
Listings Under Contract:
- Over the last 52 weeks, 3,256,348 properties have gone into contract, representing a 9.8% decrease relative to the same period in 2021.
Percentage of total contract volume since August 2021, broken down by home price:
- $0-$200k: 15.7%
- $200k-$400k: 38.4%
- $400k-$600k: 23.2%
- $600k-$1mm: 15.2%
- >$1mm: 7.5%
Percent change in contract volume over the last 52 weeks versus the same period in 2021, broken down by home price:
- $0-$200k: -22.9%
- $200k-$400k: -17.4%
- $400k-$600k: +3.6%
- $600k-$1mm: +7.3%
- >$1mm: +0.9%
Monthly Contract Volume (Single-Family Detached Homes):
- For the month of August, there were 315,977 listings that went under contract nationwide, which is a 14.5% decrease year-over-year.
For the month of August, the percent change in contract volume compared to August 2021, broken down by home price:
- $0-$200k: -18.3%
- $200k-$400k: -18.7%
- $400k-$600k: -8.2%
- $600k-$1mm: -6.6%
- >$1mm: -15.0%
Median Listing Price Activity (Single-Family Detached Homes):
- For the week ending September 2, 2022, the median price of all single-family listings in the U.S. was $433,473, a 13.1% increase year-over-year.
- For the week ending September 2, 2022, the median closed price of single-family listings in the U.S. was $405,952, a 7.4% increase year-over-year.
- The median price of all single-family listings in the U.S. is down by 1.8% month-over-month and the median price of closed listings has increased by 0.2% month-over-month.
To see the report in its entirety, including state-level breakdowns of data, click here. [2]