 It’s a well-documented fact that Black and Latino families have considerably less wealth than their white counterparts. According to the 2019 Survey of Consumer Finances [1] conducted by the Federal Reserve, on average white families held $983,400 in accumulated wealth, while black families had $142,500 while Latino families had $165,500 in wealth.
Due to the fact that most people in the country derive their wealth from their home, having accurate, unbiased home valuations makes a lot of sense.
But citing data from the Federal Housing Finance Agency’s (FHFA) Uniform Appraisal District (UAD) Aggregate Statistics Dashboard, a blog post from the FHFA said data suggests there are still racial and ethnic differences in home valuations.
“The Brookings Institute [2] showed a robust relationship between lower valuations and Black neighborhoods,” wrote Jonathan Liles, Senior Financial Analyst for the FHFA. “FHFA's Chandra Broadnax [3] highlighted examples of overt references to race in appraisals and the importance of appraisals in the discussion of wealth inequality. Freddie Mac's research [4] showed that properties in minority tracts are more likely than properties in White tracts to receive an appraisal lower than the contract price. Fannie Mae's publication [5] concluded that White borrowers' homes were overvalued at higher rates across all neighborhoods, but stronger effects were present for White borrowers in Black neighborhoods.”
Using this information as a base set, the UAD statistics published by the FHFA includes a statistic that shows the percentage of properties that appraise for less than what a buyer has offered to pay, otherwise known as the contract price. UAD Aggregate Statistics, including undervaluation, are available by state and by metro area, and by the racial/ethnic demographic composition of the census tract.
“Undervaluation, from an appraisal perspective, creates additional risk for the buyer and seller in a transaction, as the loan may not be supported by the property as collateral,” Liles wrote. “This may lead to a renegotiated sales price as the buyer or seller would have to make up the difference to offset the risk to the lender. In addition, the loan is more likely not to close, as any one of the parties may walk away from the transaction.
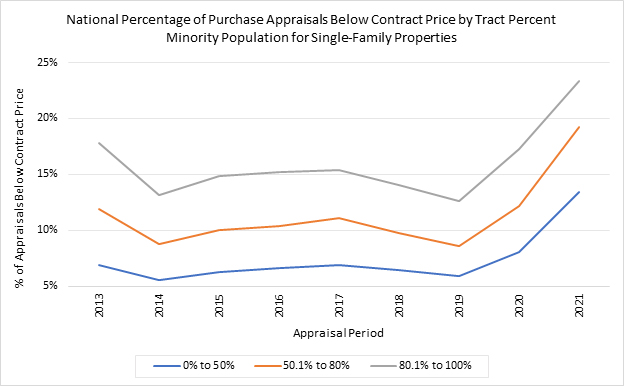
The UAD Aggregate Statistics highlight that properties located in minority tracts have a higher proportion of appraised values less than the contract price. According to the 2021 appraisal statistics, 23.3% of homes in high minority tracts (80.1-100%) experienced undervaluation. This is compared to 13.4% of homes in White tracts (0-50%) and 19.2% in minority tracts (50.1-80%). Using the proportion as a ratio with White tracts as the control group yields a value of 1.74 for high minority tracts and 1.43 for minority tracts.
In other words, the proportion of properties that are undervalued in high minority tracts is 74% greater than the proportion in White tracts. In minority tracts, the comparable proportion of undervaluation is 43% greater than in White tracts.
“From a practical perspective, compliance departments of lenders and appraisal management companies could use the UAD Aggregate Statistics Dashboards to narrow the scope of an exam or compliance review related to appraisal bias,” Liles concluded. “For example, in 2021 in the Charlotte, North Carolina Metropolitan Statistical Area, reviewers may want to focus on minority tracts (50.1-80%), which have a higher proportion of undervaluation than high minority and White tracts (Figure 3).”
Click here [6] to see the research as a whole.