
 DSNews The homepage of the servicing industry


 A recent examination of data by Realtor.com took a closer look at the impact of flooding and wildfire risk and the risk of these natural disasters and their impact on consumer behavior and home prices.
Realtor.com’s report found that the cumulative price growth of low-risk homes consistently outperformed the rate of high-risk homes, suggesting that flood risks are reflected in housing prices. The divergence in growth rate was more prominent in more risk-prone areas. Low-risk homes in Florida, North Carolina, and South Carolina counties outpaced high-risk homes
While the cumulative price growth of low-risk homes consistently outpaced the rate of high-risk homes in the second quarter of 2022, affordability concerns pushed up the demand for endangered homes—a pattern found to be more pronounced in California.
Realtor.com reported that the price gap per square foot between California low-risk and high-risk homes narrowed from a high of 10.5% to 8.7%, suggesting that homebuyers lose the suburbs’ affordability and face higher wildfire risks by purchasing homes in risk-prone areas.
Realtor.com analyzed median sale prices per square foot for homes with different flood factors designated by First Street Foundation in 271 counties across 41 states between the first quarter of 2016 and the second quarter of 2022. For the survey, a low-risk home was defined as a property with a flood factor ranging between one and four, and a high-risk home as a property with a flood factor rate between five and 10. Luxury homes were excluded from the findings, defined as those having sale prices within the top 10% in their respective quarter, to account for the sometimes very different real estate market trends for these types of homes.
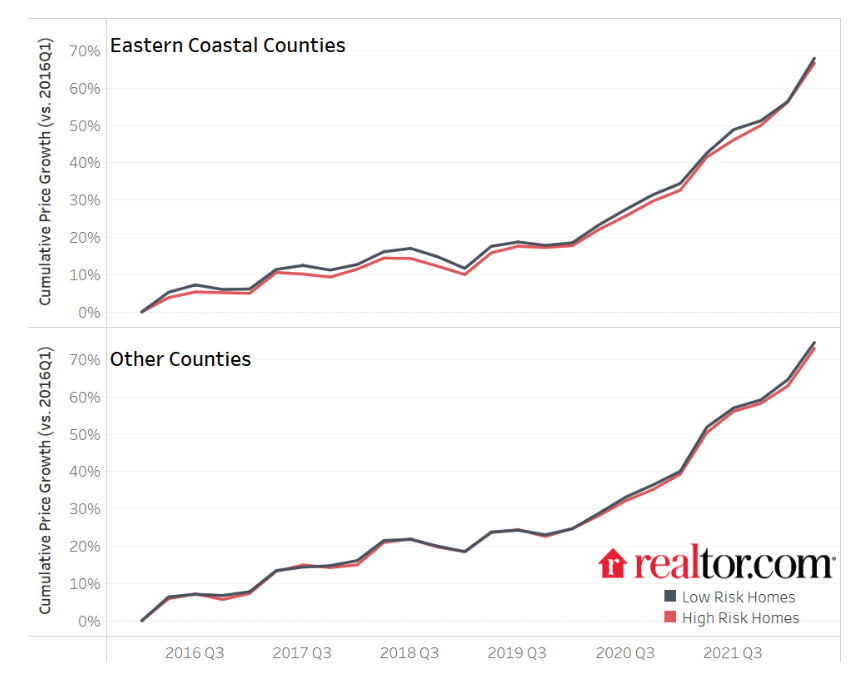
Cumulative price growth for low-risk homes between Q1 of 2016 and Q2 of 2022 consistently outpaced the rate among high-risk homes, suggesting that flood risks are reflected in housing prices. By the second quarter of 2022, the cumulative price growth of low-risk homes across all counties was 72%, 1.5 percentage points higher than the rate of high-risk homes. During the last flood-related disaster season (Q3 of 2021), the growth rate gap between low-risk and high-risk homes was 1.7 percentage points.
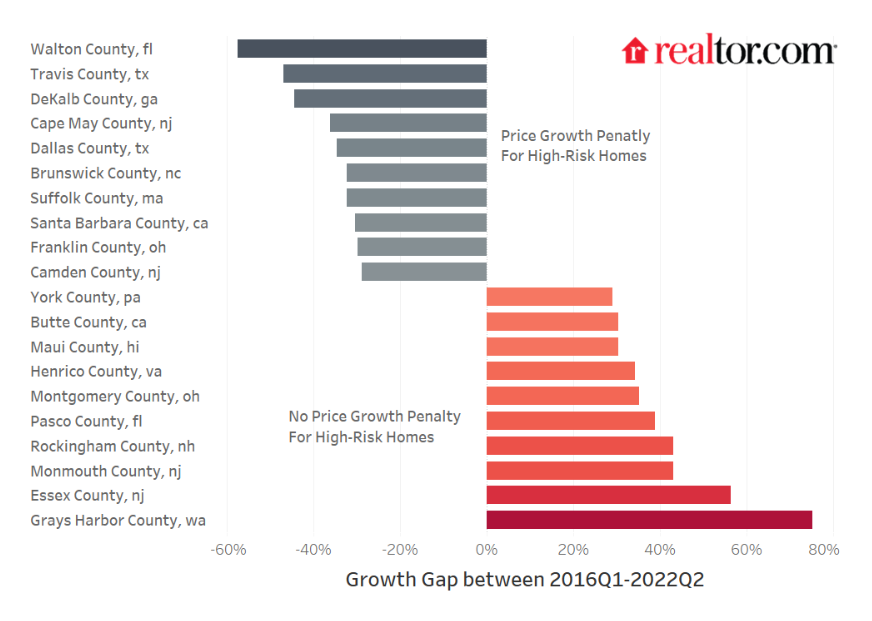
The graph above shows the Top 10 counties where high-risk homes experienced the largest cumulative price growth gap compared to low-risk homes. It may not be surprising that the high-risk homes with the slowest price appreciation clustered in counties from Florida, Texas, Georgia, New Jersey, and North Carolina. However, there is sometimes diversity in the price growth trends within a state. For example, high-risk homes in Walton County, Florida saw the slowest cumulative price growth compared to safer homes (58 percentage points less). However, in Pasco County, Florida, high-risk homes outpaced low-risk homes by 39 percentage points cumulatively. In New Jersey, Cape May County and Camden County have seen high-risk homes appreciate 36 and 29 percentage points less over these six years. In contrast, high-risk homes in Essex County and Monmouth County saw sale prices grow by 56 and 43 percentage points more over this period.
In terms of Florida, although commonly a destination for those migrating from elsewhere, the impacts of storms like the recent Hurricane Ian can be far reaching. When Hurricane Ian made landfall, it became the costliest Florida storm since Hurricane Andrew hit the Sunshine State in 1992. CoreLogic estimates the damage and loss totals from Hurricane Ian—including total flood and wind losses—between $41 billion and $70 billion. This total includes wind loss, re-evaluated insured and uninsured storm surge loss and newly calculated inland flood loss for residential and commercial properties.
Further, Redfin found that pending home sales fell 58% year-over-year in the Cape Coral, Florida metro area during the four weeks ending October 16 in the aftermath of Hurricane Ian. That total is nearly twice the nationwide decline of 32%. Pending home sales also slumped in the nearby Naples (-52%) and North Port (-51%) metro areas over that same time span. Other Florida metros were impacted by the storm, as sales fell 47% in Miami, 46% in Jacksonville and 43% in West Palm Beach, while sales were down more than 40% in the Deltona, Tampa, and Orlando metros.
The divergence in growth rate between low-risk and high-risk homes correlates with homebuyers’ risk awareness. In other words, when shopping in more risk-prone regions, homebuyers’ desire to live in safer homes can expand the price growth gap between the two types of homes. For example, Eastern Coastal regions of the U.S. are hit most by flood-related disasters. As a result, the cumulative growth rate gap between the low-risk and high-risk homes in these counties is wider than counties from other parts of the country over time, reflecting homebuyers’ stronger demands for safer homes in endangered areas. For example, during the last flood-related disaster season, the growth rate gap between high-risk and low-risk homes was 2.8 percentage points in the Eastern Coastal counties, whereas the gap was 0.9 percentage points in other counties.
Over the past decade, Florida (24 times), North Carolina (16 times), and South Carolina (13 times) are the top three states along the Eastern Coast having the highest number of flood-related federally declared disasters. They are also among the states suffering the highest damage costs.
According to the NOAA National Centers for Environmental Information (NCEI), the U.S. has sustained 338 weather and climate disasters since 1980, where overall damages/costs reached or exceeded $1 billion (including CPI adjustment to 2022). The total cost of these 338 events exceeds $2.295 trillion. Florida alone had more than $51 billion in damage caused by flood-related disasters during the past 10 years, North Carolina sustained more than $22 billion, and South Carolina suffered a total loss of more than $4 billion. As a result, the growth gaps between low-risk and high-risk homes in counties within these states are wider than average. During the last flood-related disaster season, the gap between low-risk and high-risk homes was 3.6 percentage points in Florida, 3.2 percentage points in North Carolina, and 5.6 percentage points in South Carolina (vs. 1.7 percentage points in all counties).
For the study, Realtor.com analyzed residential sales in 41 states from Q1 of 2016-Q2 of 2022. Luxury homes, defined as those with a sale price in the top 10% of a county in that quarter, were excluded from this analysis, to control for the sometimes very different real estate market trends for these types of homes. Properties were then categorized according to their Flood Factor Rating, and the scores were consolidated into ‘low risk’ and ‘high risk’ categories. Counties with too few sales within a given category and a given quarter were also excluded from the analysis, with 271 counties remaining.
Click here for more information on Realtor.com's findings.


