
 DSNews The homepage of the servicing industry


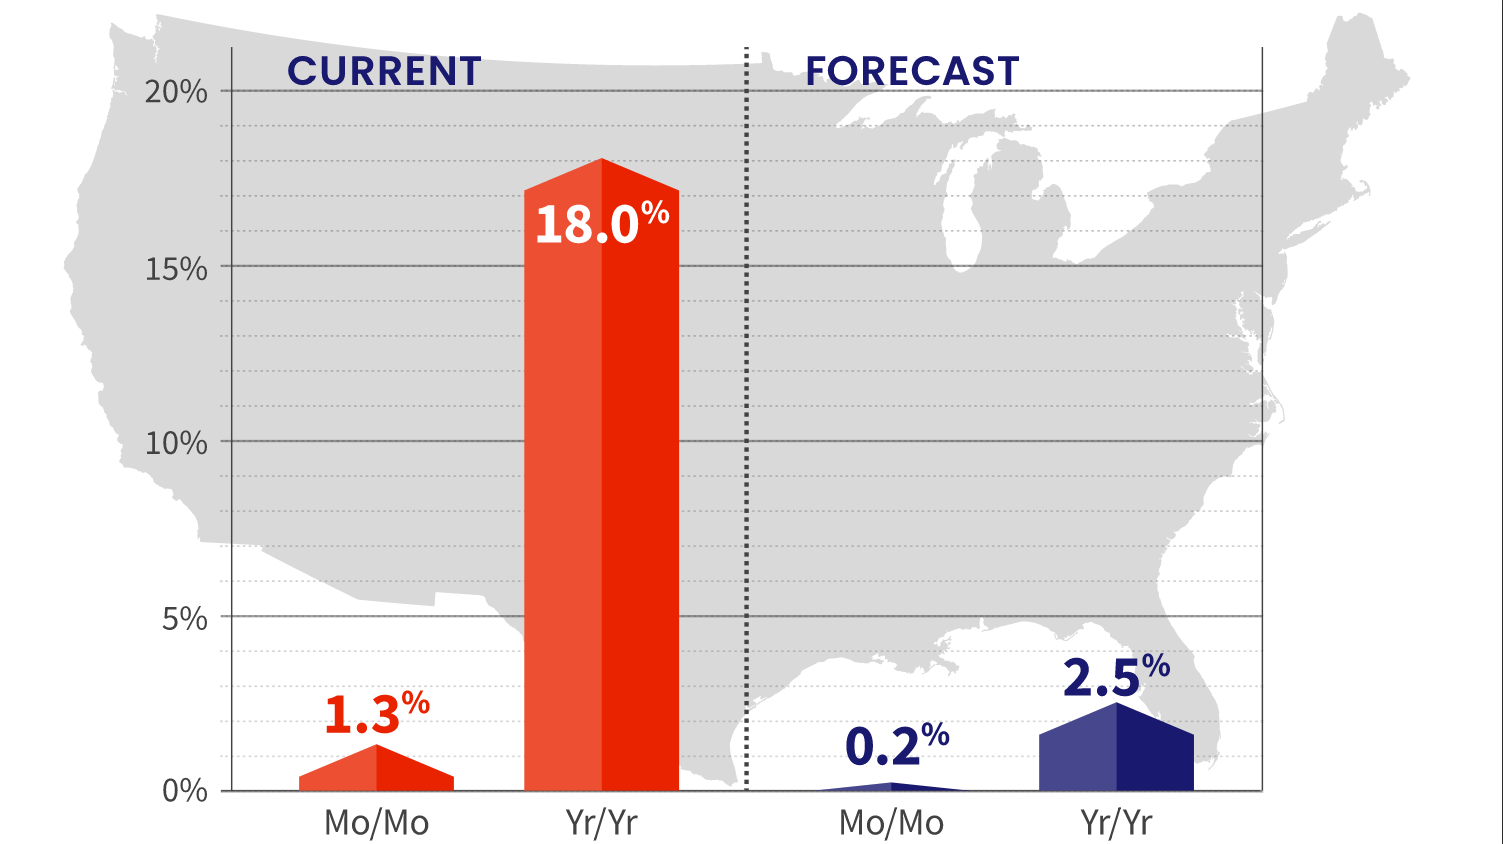
 Another record has fallen as CoreLogic’s latest Home Price Index (HPI) and HPI Forecast for October 2021 revealed that home prices increased by 18% year-over-year, the highest level seen since the index was started 45 years ago.
However, on a monthly basis home prices grew by 1.2% since September; a slower pace than has been seen in recent months.
Still, the survey found that at least half of respondents in every demographic still viewed homeownership as a major goal of theirs despite affordability concerns.
“New household formation, investor purchases and pandemic-related factors driving demand for the limited supply of available for-sale homes continues to propel the upward spiral of U.S. home prices,” said Frank Martell, President and CEO of CoreLogic. “However, we expect home price growth to moderate over the near term as many buyers take a break for the holidays.”

CoreLogic also found that in October, appreciation of detached properties (19.5%) was 6.6 percentage points higher than that of attached properties (12.9%).
Looking ahead, the report predicts that home prices will level off in the near future while predicting future annual growth of 2.5% or 0.2% per month.
“New household formation, investor purchases and pandemic-related factors driving demand for the limited supply of available for-sale homes continues to propel the upward spiral of U.S. home prices,” Martell continued. “However, we expect home price growth to moderate over the near term as many buyers take a break for the holidays.”
On a state level, the 10 areas that saw the biggest home price increase were:
- Arizona with a 28.8% change
- Idaho with a 28.7% change
- Utah with a 24.5% change
- Florida with a 24.4 change
- Nevada with a 24.2% change
- Montana with a 24.2% change
- Tennessee with a 23.6% change
- Vermont with a 21.6% change
- North Carolina with a 21.1% change
- Washington with a 20.8% change
Among major metropolitan areas, the top 10 cities that saw the largest increases were:
- Phoenix with a 30.5% change
- Las Vegas with a 24% change
- San Diego with a 21.6% change
- Denver with a 14.5% change
- Miami with a 14.7% change
- Houston with a 14.5% change
- Los Angeles with a 14.1% change
- Washington D.C. with a 11.3% change
- Boston with a 10.9% increase
- Chicago with a 8.8% increase


