
 DSNews The homepage of the servicing industry


According to a new report from Redfin, the share of U.S. homes for sale dropped 6% from a year earlier, representing the biggest decline in 13 months.
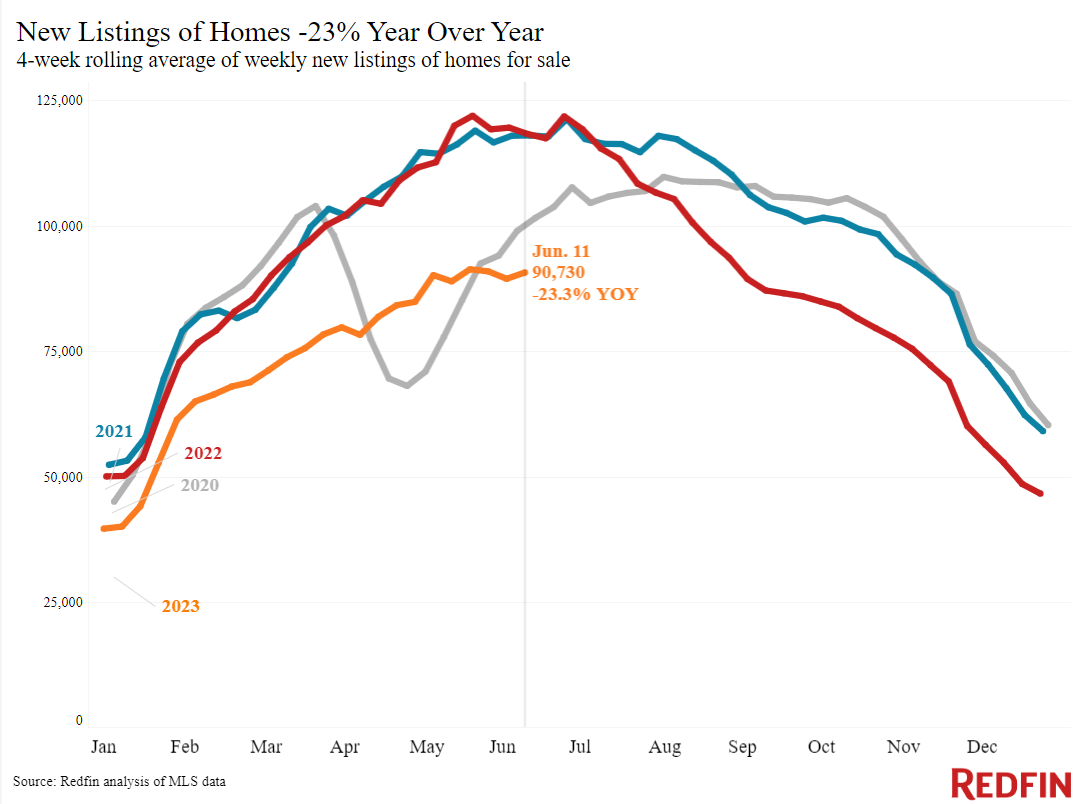
New listings also dropped 23%, continuing a 10-month streak of double-digit declines. Those add to the growing post-pandemic inventory shortage, as new data finds there are 39% fewer homes for sale now than there were five years ago, in June 2018.
The inventory crunch is partly due to a homebuilding slump that’s lasted for over a decade and partly to mortgage rates falling to record-low levels during the pandemic, then skyrocketing. Mortgage rates have more than doubled since 2021, landing at close to 7% this week. The record-low mortgage rates of 2020 and 2021 drove a homebuying boom, depleting inventory. When rates started going up at the beginning of 2022, many would-be home sellers backed off, failing to fill the inventory hole. Elevated rates continue to discourage homeowners who would prefer to hold onto a comparatively low rate from selling.
Leading indicators of homebuying activity:
- The daily average 30-year fixed mortgage rate was 6.95% on June 14, down from a seven-month high of 7.14% three weeks earlier but up from about 6.6% a month earlier. For the week ending June 8, the average 30-year fixed mortgage rate was 6.71%, down slightly from 6.79% the week before but still close to the highest rate since November.
- Mortgage-purchase applications during the week ending June 9 increased 8% from a week earlier, seasonally adjusted. Purchase applications were down 27% from a year earlier.
- The seasonally adjusted Redfin Homebuyer Demand Index was essentially unchanged from a week earlier during the week ending June 11, but up from two weeks earlier. It was up 7% from a year earlier, the third consecutive annual increase. Demand was dropping at this time in 2022 as mortgage rates rose.
- Google searches for “homes for sale” were up 15% from a month earlier during the week ending June 10, and down about 10% from a year earlier.
- Touring activity as of June 11 was up 20% from the start of the year, compared with a 4% increase at the same time last year, according to home tour technology company ShowingTime. Tours declined during this time last year as mortgage rates shot up.
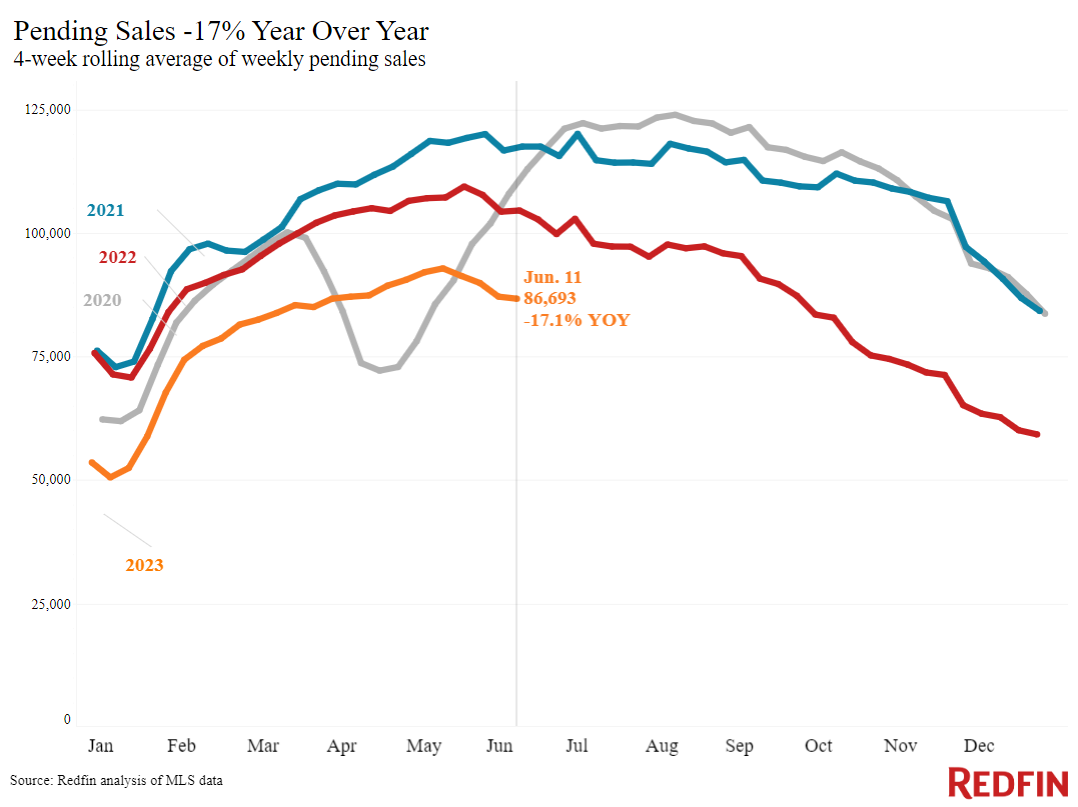
Pending home sales are down 17% year-over-year, the biggest decline in over four months, but it isn’t all due to a lack of demand. People are still showing interest in homebuying. Mortgage-purchase applications rose 8% over the last week, and Redfin’s Homebuyer Demand Index is up over the last two weeks, near its highest level in a year. That means there’s a fair amount of pent-up demand, and many homebuyers will be ready to jump when more homes hit the market. Demand significantly outpacing supply is preventing home prices from falling drastically. New data also found that the median sale price is down just 1.1%, the smallest annual decline in three months.
This week’s economic news indicates that mortgage rates are unlikely to decline in the next few months, which may mean new listings stay low for the time being and the inventory shortage grows. The latest inflation report shows that price increases have continued to cool, and the Fed announced that it will pause interest rate hikes this month after nearly a year of increases but may hike a couple more times this year.
“The Fed’s indication that there are more rate hikes to come is not what homebuyers want to hear. It’s likely to keep mortgage rates elevated and may even push them up a bit,” said Redfin Economics Research Lead Chen Zhao. “People who are sitting on the sidelines, waiting for mortgage rates to decline, should know that’s unlikely to happen in the foreseeable future. If a home that's in your price range and has everything on your wish list hits the market, there's no good reason to wait.”
Key housing market takeaways for 400+ U.S. metro areas:
- The median home sale price was $381,169, down 1.1% from a year earlier, the smallest decline in more than three months. Price declines have been shrinking for the last seven weeks.
- Home-sale prices declined in 31 metros, with the biggest drops in Austin, TX (-13.1% YoY), Las Vegas (-9%), Oakland, CA (-7.4%), Phoenix (-6.9%), and Los Angeles (-6.7%).
- Sale prices increased most in Miami (8.9%), Cincinnati (8.3%), Fort Lauderdale, FL (6.1%), Milwaukee (5.9%), and Virginia Beach, VA (4.8%).
- The median asking price of newly listed homes was $398,475, up 0.3% from a year earlier.
- The monthly mortgage payment on the median-asking-price home was $2,640 at a 6.71% mortgage rate, the average for the week ending June 8. That’s down slightly from the record high hit two weeks earlier, but up 8% ($200) from a year earlier.
- Pending home sales were down 17.1% year over year, the biggest decline in more than four months.
- Pending home sales fell in all metros Redfin analyzed. They declined most in Providence, RI (-30.8% YoY), Portland, OR (-29.1%), Milwaukee (-28.2%), Seattle (-26.9%), and San Diego (-26.6%).
- New listings of homes for sale fell 23.3% year over year, roughly on par with the declines over the last two months.
- New listings declined in all metros Redfin analyzed. They fell most in Phoenix (-40.9% YoY), Las Vegas (-40.5%), Oakland (-39.6%), Seattle (-35.9%), and Anaheim, CA (-34.7%).
- Active listings (the number of homes listed for sale at any point during the period) dropped 6.3% from a year earlier, the third consecutive annual decline and the biggest drop in over a year. Active listings were essentially unchanged from a month earlier; typically, they post month-over-month increases at this time of year.
- Months of supply—a measure of the balance between supply and demand, calculated by the number of months it would take for the current inventory to sell at the current sales pace—was 2.6 months, up from 2.1 months a year earlier. Four to five months of supply is considered balanced, with a lower number indicating seller’s market conditions.
- Some 33.2% of homes that went under contract had an accepted offer within the first two weeks on the market, down from 37% a year earlier.
- Homes that sold were on the market for a median of 28 days, the shortest span since September. That’s up from a near-record low of 19 days a year earlier.
- An estimated 35.9% of homes sold above their final list price. That’s the highest share since last August but is down from 54% a year earlier.
- On average, 5.3% of homes for sale each week had a price drop, up from 4.3% a year earlier.
- The average sale-to-list price ratio, which measures how close homes are selling to their final asking prices, was 99.9%. That means homes are selling for almost exactly their asking price, on average. That’s the highest level since August but is down from 102.3% a year earlier.
To read the full report, including more data, charts, and methodology, click here.


