
 DSNews The homepage of the servicing industry


 According to a new report from Redfin, the median U.S. home-sale price increased 1.5% during the four weeks prior to July 9—the first increase in five months.
The report also found that the average weekly mortgage rate is at its highest level since November 2022, bringing the typical monthly payment to $2,627, a near-record high.
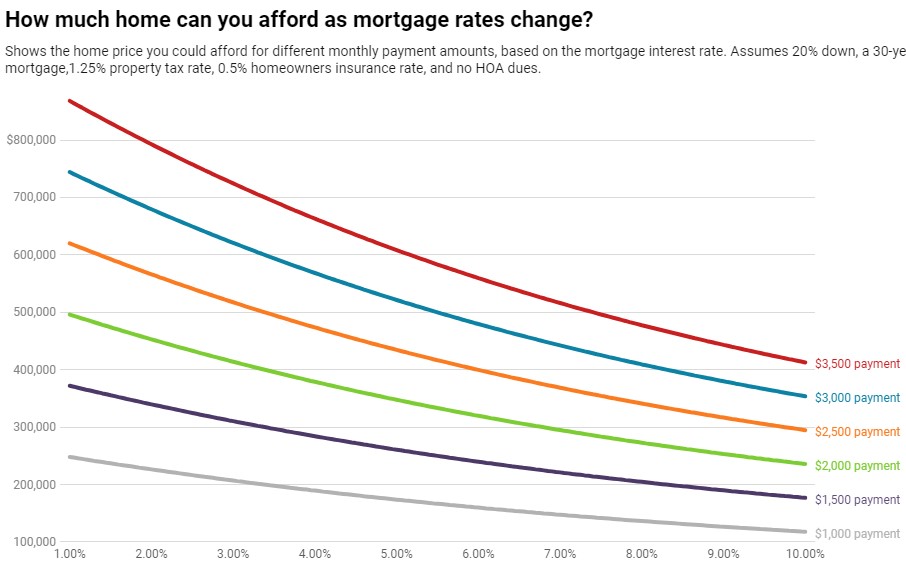
Looking at that number another way, a homebuyer with a $3,000 monthly budget can afford a home priced at about $450,000 at today’s mortgage rate. That buyer has lost $30,000 in purchasing power since February when the buyer could afford a home of $480,000. This drop is more extreme when compared to a year ago, when a $3,000 budget would have been able to purchase a home valued at about $510,000 at the then rate of 5.3%.
According to Redfin, home prices are rising despite relatively low demand because of the low number of homes available for sale. New listings are down 27% year over year, the biggest drop since the start of the pandemic, and the total number of homes on the market is down 14%, the biggest drop since March 2022. That’s mostly because potential sellers are locked in by low rates; nearly all homeowners have a rate below 6%.
Looking up, weekly numbers are providing the housing market with a bit of hope: the latest consumer-price index report shows that inflation cooled more than expected in June, largely because it has started reflecting months of cooling housing costs.
“This month’s inflation report is likely to bring mortgage rates down a bit from their recent highs. It shows that the Fed’s interest-rate hikes are working and increases the chance they’ll only hike rates one more time this year,” said Redfin Economic Research Lead Chen Zhao. “Because elevated mortgage rates are responsible for both of today’s major homebuying challenges—high monthly housing payments and low inventory—any decline is welcome news for buyers. But even though rates will come down slightly, they’ll likely remain well above 6% until the Fed sees several more months of inflation readings closer to their target.”
Leading indicators of homebuying activity, as highlighted by Redfin include:
- The daily average 30-year fixed mortgage rate was 6.96% on July 12, down from a half-year high of 7.22% a week earlier. For the week ending July 6, the average 30-year fixed mortgage rate was 6.81%, the highest level since November.
- Mortgage-purchase applications during the week ending July 7 rose 2% from a week earlier, seasonally adjusted. Purchase applications were down 26% from a year earlier.
- The seasonally adjusted Redfin Homebuyer Demand Index—a measure of requests for home tours and other homebuying services from Redfin agents—was essentially flat from the week earlier and near its highest level since May 2022 during the week ending July 9. It was up 5% from a year earlier, the seventh consecutive annual increase. Demand was dropping at this time in 2022 as mortgage rates fluctuated.
- Google searches for “homes for sale” were up essentially flat from a month earlier during the week ending July 8, and down about 15% from a year earlier.
- Touring activity as of July 9 was up 4% from the start of the year, compared with a 10% decrease at the same time last year, according to home tour technology company ShowingTime. Tours increased slowly during this time last year as mortgage rates shot up.
- The median home sale price was $383,750, up 1.5% from a year earlier. That’s the first year-over-year increase since February, and just $2,500 shy of the record high hit in June 2022.
- Sale prices increased most in Milwaukee (13.5% YoY), Providence, RI (9.2%), Miami (7.8%), Cincinnati (6.7%) and Newark, NJ (6.7%).
- Home-sale prices declined in 19 metros, with the biggest drops in Austin, TX (-9% YoY), Detroit (-7.4%), Las Vegas (-6%), Phoenix (-5.5%) and Fort Worth, TX (-5.3%).
- The median asking price of newly listed homes was $393,248, up 1.3% from a year earlier. Asking prices have been increasing for a month.
- The monthly mortgage payment on the median-asking-price home was $2,627 at a 6.81% mortgage rate, the average for the week ending July 6. That’s on par with the record high hit a week earlier, and up 13% ($305) from a year earlier.
- Pending home sales were down 14.8% year over year, continuing a year-plus streak of double-digit declines.
- Pending home sales fell in all but one of the metros Redfin analyzed. They declined most in Cleveland (-34.9% YoY), Newark, New Jersey (-24.8%), Warren, Michigan (-24.1%), Milwaukee (-23%) and Cincinnati (-22.5%). They increased 4.6% in Austin.
- New listings of homes for sale fell 26.8% year over year, the biggest decline since May 2020.
- New listings declined in all metros Redfin analyzed. They fell most in Las Vegas (-49% YoY), Phoenix (-41.6%), Cleveland (-39.8%), Providence, Rhode Island (-39.1%) and Newark, New Jersey (-36.9%).
- Active listings (the number of homes listed for sale at any point during the period) dropped 14.4% from a year earlier, the biggest drop since March 2022. Active listings were down slightly from a month earlier; typically, they post month-over-month increases at this time of year.
- Months of supply—a measure of the balance between supply and demand, calculated by the number of months it would take for the current inventory to sell at the current sales pace—was 2.8 months, the highest level in nearly three months. Four to five months of supply is considered balanced, with a lower number indicating seller’s market conditions.
- 30.5% of homes that went under contract had an accepted offer within the first two weeks on the market, on par with the share a year earlier.
- Homes that sold were on the market for a median of 27 days, the shortest span in 10 months. That’s up from 21 days a year earlier.
- 36.8% of homes sold above their final list price, down from 49% a year earlier.
- On average, 5.5% of homes for sale each week had a price drop, down just slightly from 5.7% a year earlier.
- The average sale-to-list price ratio, which measures how close homes are selling to their final asking prices, was 100.1%. That’s the second time in nearly a year that the typical home is selling above its asking price, on average. It’s down from 101.5% a year earlier.
Click here to view the report in its entirety.


