
 DSNews The homepage of the servicing industry


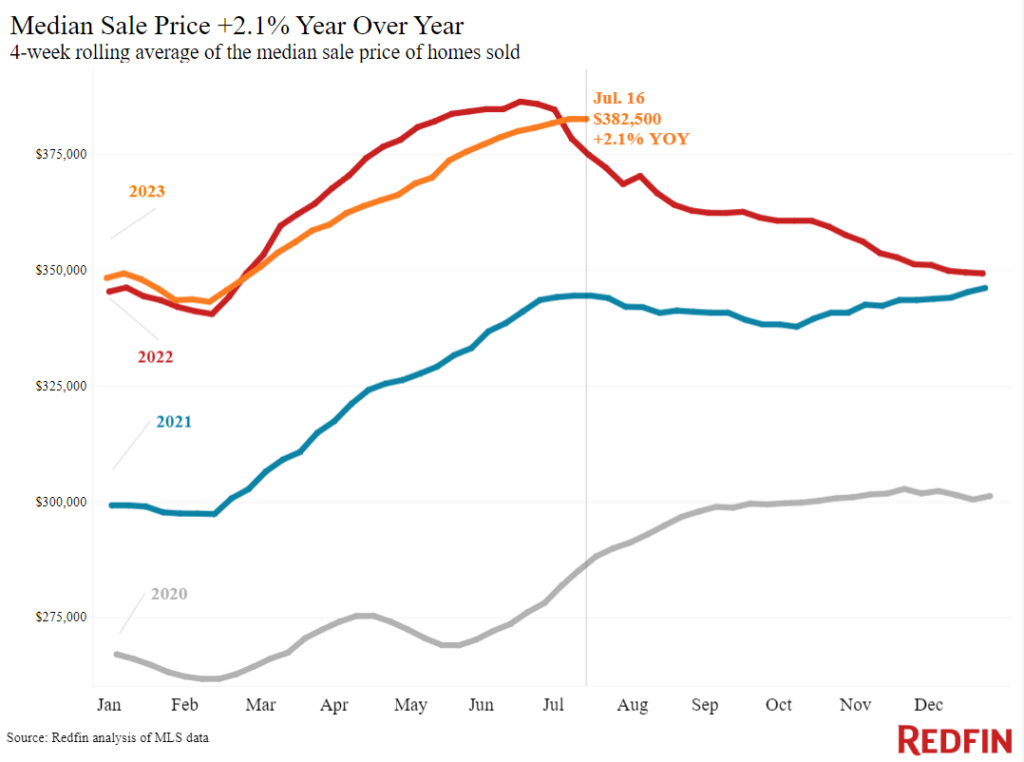
 After five months of home sale price declines, the typical U.S. home sold for $382,500, or an increase of 2.1% year-over-year. This marks the biggest increase since December 2022 according to Redfin’s latest Housing Market Update covering the four weeks preceding July 16.
Prices in some major metropolitan areas are still substantially rising, as they are in Milwaukee, where the housing market remained relatively steady throughout the pandemic era. On the other hand, prices in other major metropolitan areas are dropping, as seen in Phoenix and Austin, who experienced booms during the pandemic.
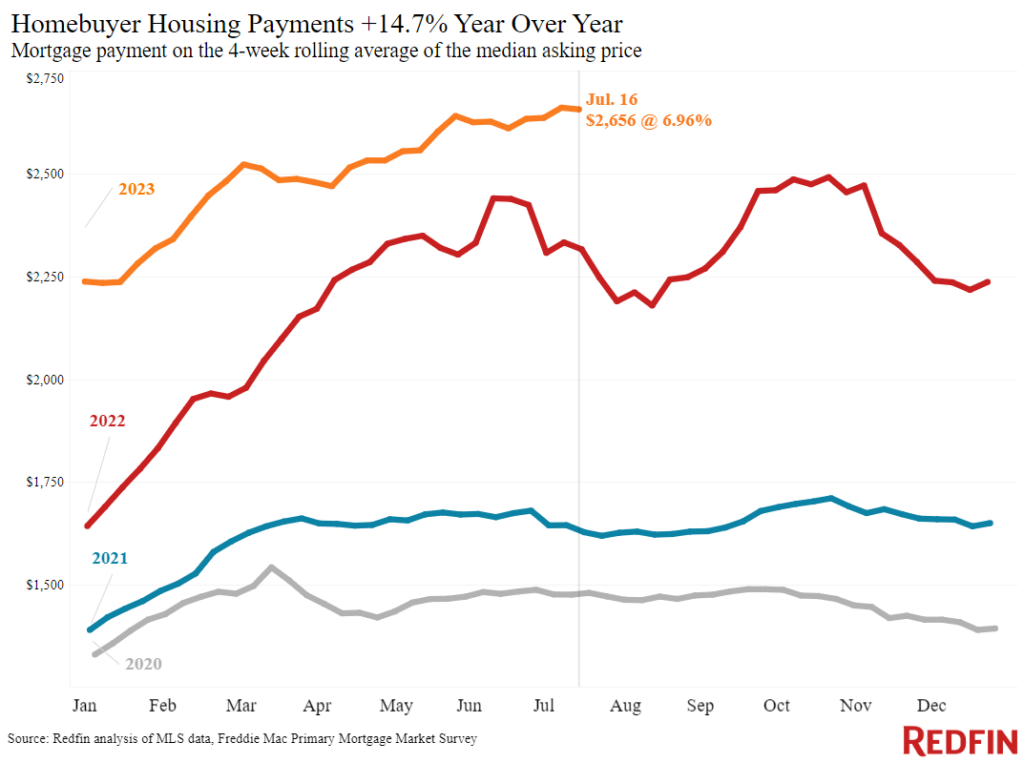
The high home prices, fueled by a lack of inventory and rising mortgage rates, have pushed the typical homebuyer’s monthly payment to a record $2,656. Daily mortgage rates have been dropping due to cooling inflation, but according to Redfin, housing payments are likely to remain elevated because even slightly lower rates may escalate competition for the few homes on the market and push up prices for the foreseeable future.
Redfin further continued by saying that prices are rising because there’s more demand than supply; pending home sales are down 15% year-over-year while new listing are down 25%. The total number of homes for sale is down 16%, the biggest dip in a year and a half, and inventory also posted an unseasonal monthly decline.
“Even though buyers are trepidatious about high mortgage rates, we’re seeing bidding wars in several pockets of the market because there are so few options and even fewer good options,” said Raleigh, North Carolina Redfin Premier Agent Jordan Hammond. “Condos, townhouses and new construction homes are selling quickly, partly because they don’t require much work and people can’t afford to fix up a home when they have such high monthly mortgage payments. After over a year of high rates, buyers are getting used to lowering their budgets, searching for smaller homes, and thinking outside the box to reduce their monthly payments, doing things like rate buydowns or large down payments.”
Leading indicators of homebuying activity, as highlighted by Redfin include:
- The daily average 30-year fixed mortgage rate was 6.87% on July 19, down from a half-year high of 7.22% two weeks earlier. For the week ending July 13, the average 30-year fixed mortgage rate was 6.96%, the highest level since November.
- Mortgage-purchase applications during the week ending July 14 declined 1% from a week earlier, seasonally adjusted. Purchase applications were down 21% from a year earlier.
- The seasonally adjusted Redfin Homebuyer Demand Index was down from the week earlier but up 2% from a year earlier, the eighth consecutive annual increase. Demand was dropping at this time in 2022 as mortgage rates fluctuated.
- Google searches for “homes for sale” were up essentially flat from a month earlier during the week ending July 15, and down about 14% from a year earlier.
- Touring activity as of July 17 was up 17% from the start of the year, compared with a 1% decrease at the same time last year, according to home tour technology company ShowingTime. Tours increased slowly during this time last year as mortgage rates fluctuated.
- The median home sale price was $382,500, up 2.1% from a year earlier. That’s the second straight year-over-year increase after more than four months of declines.
- Sale prices increased most in Milwaukee (12.2% YoY), Miami (9.7%), Cincinnati (9.5%), Newark, NJ (7.3%) and Anaheim, CA (6.9%).
- Home-sale prices declined in 20 metros, with the biggest drops in Austin, TX (-9.2% YoY), Detroit (-5.5%), Las Vegas (-5.5%), Phoenix (-5.1%) and Fort Worth, TX (-5.1%).
- The median asking price of newly listed homes was $392,875, up 2.1% from a year earlier. Asking prices have been increasing for more than a month.
- The monthly mortgage payment on the median-asking-price home hit a record $2,656 at a 6.96% mortgage rate, the average for the week ending July 13. That’s up 15% from a year earlier.
- Pending home sales were down 14.8% year over year, continuing a year-plus streak of double-digit declines. Pending home sales fell in all but one of the metros Redfin analyzed. They declined most in Cleveland (-30.4%), Newark, NJ (-27.6% YoY), Providence, RI (-26.5%), Warren, MI (-26.2%) and Boston (-24.7%). They increased 2.8% in Austin.
- New listings of homes for sale fell 25.1% year over year.
- New listings declined in all metros Redfin analyzed. They fell most in Las Vegas (-47.8% YoY), Phoenix (-41.1%), Providence, RI (-36.9%), Seattle (-35.8%) and Newark, NJ (-34.8%).
- Active listings (the number of homes listed for sale at any point during the period) dropped 16.1% from a year earlier, the biggest drop since February 2022. Active listings were down slightly from a month earlier; typically, they post month-over-month increases at this time of year.
- Months of supply—a measure of the balance between supply and demand, calculated by the number of months it would take for the current inventory to sell at the current sales pace—was 2.8 months, the highest level since April. Four to five months of supply is considered balanced, with a lower number indicating seller’s market conditions.
- 29.8% of homes that went under contract had an accepted offer within the first two weeks on the market, on par with the share a year earlier.
- Homes that sold were on the market for a median of 27 days, the shortest span in 10 months. That’s up from 22 days a year earlier.
- 36.6% of homes sold above their final list price, down from 47% a year earlier.
- On average, 5.7% of homes for sale each week had a price drop, on par with 5.8% a year earlier.
- The average sale-to-list price ratio, which measures how close homes are selling to their final asking prices, was 100%. That’s down from 101.2% a year earlier.


