
 DSNews The homepage of the servicing industry


 S&P Dow Jones Indices (S&P DJI) has released the latest results for the S&P CoreLogic Case-Shiller Indices for July 2023, showing that 19 of the 20 major metro markets reported month-over-month price increases.
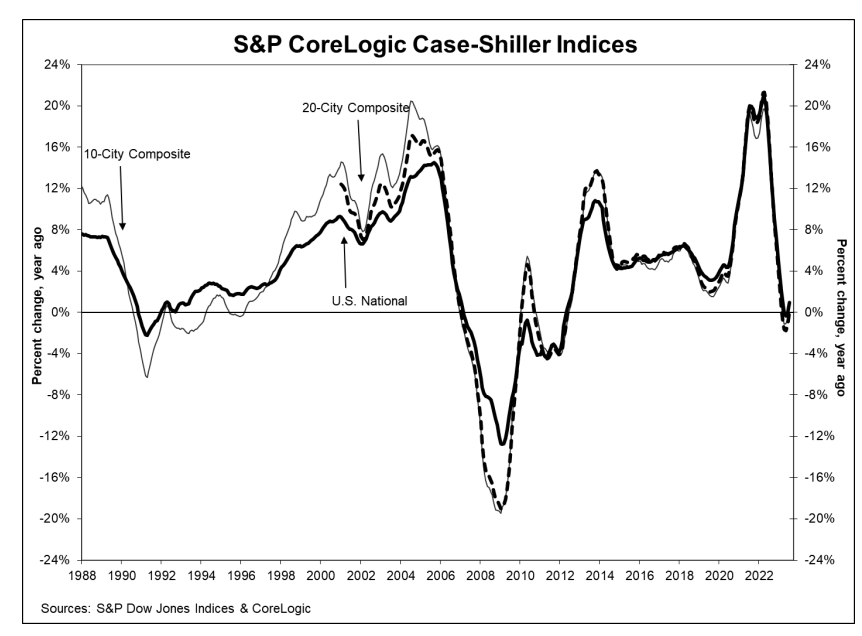
The S&P CoreLogic Case-Shiller U.S. National Home Price NSA Index—covering all nine U.S. census divisions—reported a 1% annual change in July, up from a 0% change in the previous month. The 10-City Composite showed an increase of 0.9%, which improves from a -0.5% loss in the previous month, while the 20-City Composite posted a year-over-year increase of 0.1%, improving from a loss of -1.2% in the previous month.
“After a strong, 5% cumulative U.S. home price gain since the early spring, monthly increases are plateauing to a seasonal average, which reflects the pressure that higher mortgage rates have put on affordability,” said CoreLogic Chief Economist Dr. Selma Hepp. “As a result of the early 2023 growth, annual price appreciation should accelerate in the coming months before slowing again. Areas in the Midwest continue to lead the national gains given their relative affordability. Markets that saw home prices reset following the recent surge in mortgage rates are expected to see stronger gains over the next 12 months, particularly those in the West.”
“U.S. home prices continued to rally in July 2023,” said Craig J. Lazzara, Managing Director at S&P DJI. “Our National Composite rose by 0.6% in July, and now stands 1.0% above its year-ago level. Our 10- and 20-City Composites each also rose in July 2023, and likewise stand slightly above their July 2022 levels. We have previously noted that home prices peaked in June 2022 and fell through January of 2023, declining by 5.0% in those seven months. The increase in prices that began in January has now erased the earlier decline, so that July represents a new all-time high for the National Composite. Moreover, this recovery in home prices is broadly based. As was the case last month, 10 of the 20 cities in our sample have reached all-time high levels. In July, prices rose in all 20 cities after seasonal adjustment (and in 19 of them before adjustment).”
Regionally, Chicago, Cleveland, and New York led the way for the third consecutive month, reporting the highest year-over-year gains among the 20 cities in July.
Chicago remained in the top spot with a 4.4% year-over-year price increase, with Cleveland coming in at second with a 4% increase, and New York held down the third spot with a 3.8% increase. For this month, eight of 20 cities reported lower prices and 12 of 20 reported higher prices in the year ending July 2023 versus the year ending June 2023. 18 out of the 20 cities, show a positive trend in price acceleration compared to their prior month.
“Regional differences continue to be striking,” added Lazzara. “On a year-over-year basis, the Revenge of the Rust Belt continues. The three best-performing metropolitan areas in July were Chicago (+4.4%), Cleveland (+4.0%), and New York (+3.8%), repeating the ranking we saw in May and June. The bottom of the leader board reshuffled somewhat, with Las Vegas (-7.2%) and Phoenix (-6.6%) this month’s worst performers. All of the cities at all-time highs are in the Eastern or Central time zones, and with two exceptions (Dallas and Tampa), all of the cities not at all-time highs are in the Pacific or Mountain time zones. The Midwest (+3.2%) continues as the nation’s strongest region, followed by the Northeast (+2.3%). The West (-3.8%) and Southwest (-3.6%) remain the weakest regions.”
Month-over-month, before seasonal adjustment, the U.S. National Index, 10-City, and 20-City Composites, all posted a 0.6% month-over-month increase in July. After seasonal adjustment, the U.S. National Index posted a month-over-month increase of 0.6%, while the 10-City posted a 0.8% increase and 20-City Composite a 0.9% increase.
“On a year-to-date basis, the National Composite has risen 5.3%, which is well above the median full calendar year increase in more than 35 years of data,” said Lazzara. “Although the market’s gains could be truncated by increases in mortgage rates or by general economic weakness, the breadth and strength of this month’s report are consistent with an optimistic view of future results.”
Realtor.com Chief Economist Danielle Hale added, “Today’s S&P CoreLogic Case-Shiller Index showed that buyer demand continues to outmatch housing supply, creating upward pressure on home prices despite the fact that home purchase costs are taking up an outsized share of household incomes. All three measures signaled higher home prices in July. National home prices were up 1% in the year, while the 10- and 20-city composite indices were up 0.9% and 0.1%, respectively. This month’s index data tracks May, June, and July, a period when mortgage rates neared 7% in mid-July, creating the second knock of a one-two blow to housing affordability. Existing home sales, limited by low inventory as high costs cause many existing homeowners to stay put, have borne the brunt of the impact and continued to slip in July. At the same time, new home sales have started to recover as builders adapt and fill the gap created by the selling shortfall.”
While the rental market remains high nationwide, elevated mortgage rates, steep home prices and declining rent costs familiar in today's housing market have made it less costly to rent than to buy a starter home in all but three of the largest metros in the U.S., according to the Realtor.com Monthly Rental Report.
“The rental market has offered a more extended break in pricing, with rents dipping for a fourth month compared to a year ago,” said Hale. “Even here, the cumulative drop in rents is relatively modest nationwide–down less than 2% from the peak. Furthermore, regional trends vary, with some markets still seeing relatively robust rental growth. Fortunately for renters, a record-high number of multi-family units are on the way, which will provide some sustained relief over the next several months, even as multi-family starts slow.”
Median rents for 0-2 bedroom units declined consistently year-over-year for the past four months which, when combined with mortgage rates hovering above 7%, and a low enough supply to drive up prices despite subdued demand, tipped the scales further in favor of renting. In August, homeownership costs exceeded renters' monthly costs by nearly $300 compared with the start of the year.
“Taken together, trends in the for-sale and for-rent markets suggest that modest relief from today’s record-high unaffordability is on the way, but it will take time to unfold,” said Hale. “In the meantime, households who need to move now, and are ready to buy can find some solace in the fact that relatively predictable seasonal trends point to the week of October 1-7 as the best time to buy this year. During this week, home shoppers can expect to find more homes for sale and lower buyer demand than the typical week alongside prices that are below the year’s peak price.”
According to Realtor.com, approximately 4.2 million homes will change hands this year during the week of Oct. 1, according to the “Best Time to Buy” report, which identifies key factors people use when considering buying a home, mortgage rates withstanding. Realtor.com has predicted that the homebuying stars will dramatically align during the week of Oct. 1, meaning those in the market should view this week as a window of opportunity to make the most of their purchasing power.
For the upcoming period of Oct. 1-7, Realtor.com predicts the week will offer:
- Up to 17% more active listings than at the start of the year.
- Savings of more than $15,000 relative to the summer's peak price of $445,000
- More time to decide as homes are expected to stay on the market for one week longer than during this year's peak
- Less competition with demand expected to be 18.7% lower than peak buying periods


