
 DSNews The homepage of the servicing industry


 Active inventory shrank on a yearly basis in September, according to Realtor.com’s Monthly Housing Trends Report, as inventory remained 45.1% below pre-pandemic levels and fell 4% for the third consecutive month.
Although, the number of homes for sale increased month-over-month (4.9%) in September, contrary to typical seasonal trends, but is attributable to the unusual bump in new listings in August.
According to Realtor.com, new listings in the month of September realigned with typical declines recorded between August and September, as the housing market sees typical cooling as the school year starts. While a greater share of homes saw price reductions during the past month than expected for this time of year, the percentage of homes with price reductions decreased year over year, from 20.2% in September of last year to 17.8% this year, and remains below typical levels seen from 2017 to 2019. This suggests that buyer and seller expectations aren't significantly misaligned, at least for now.
"An uptick in homes with reduced prices is a small break for buyers on top of the usual seasonal factors that align to make this first week in October the best week to buy. Yet, the larger context remains challenging. Buyers still struggle with the triple threat of rising listing prices, record-high mortgage rates, and limited inventory, making affordability a continued concern," said Danielle Hale, Chief Economist for Realtor.com. "The number of homes for sale is likely to remain low as higher mortgage rates leave many homeowners feeling 'locked in' to their current rates. Data shows low inventory is pushing many homebuyers toward new homes, but the growth in new construction isn't enough to sufficiently narrow the inventory gap."
So what does all this mean for the average buyer? While the unexpected rise in new home listings were a welcome surprise from July to August which led to higher than expected inventory in September, homes are still selling quickly, keeping inventory limited. This scarcity in available listings has been a driving factor in maintaining high listing prices.
In addition, a greater share of homes are experiencing price reductions, but affortability continues to avail many due to the fact that higher mortgage rates have increased the monthly cost of financing 80% of the typical home by roughly $256, or 12.4% year-over-year. This growth has outpaced wage growth (4.3%) and inflation (3.7%).
"Homes on the market are still moving quickly, indicating that many buyers are accepting today's high prices and mortgage rates and adjusting their expectations," said Realtor.com's Executive News Editor Clare Trapasso. "That may mean a number of things: settling for less space or moving farther away from large cities or to a different region."
Other high-level data found by the report includes:
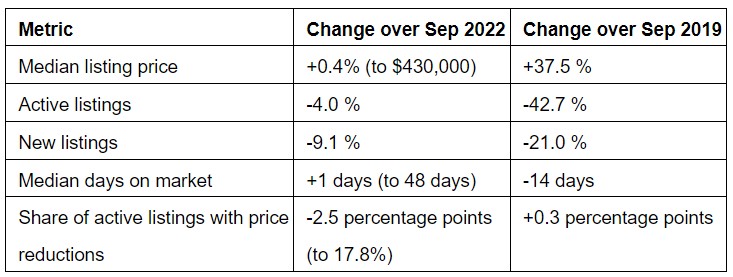
- While the U.S. median list price saw a seasonal monthly decline, to $430,000 from $435,000 in August, it is up +0.4% compared to last year.
- All regions saw active listing prices in larger metros increase on average, but Northeastern metros saw the highest annual growth rate (+10.0%).
- Prices in Los Angeles (+23.8%), San Diego (+18.2%), and Richmond, Va.. (+15.0%) saw the biggest increases among large metros, predominantly due to larger and more expensive homes coming on the market in these areas. Larger Southern metros saw the lowest listing price growth rate among the regions (3.1%).
- Among the largest 50 metros, only eight saw their median list price decline, led by San Antonio (-2.8%), Memphis, Tenn. (-2.1%), and Houston (-1.5%).
- Nationally, the share of homes with price reductions decreased from 20.2% in September of last year to 17.8% this year and remains below 2017-2019 levels on average.
- Nationally, active inventory in September dropped -4.0% year-over-year. Despite an increase in homes for sale from August to September (+4.9%), active inventory remains -45.1% below 2017-2019 levels.
- Pending listings fell -12.2% from the same time last year, more than August's -11.5% decline due in part to higher mortgage rates in July and August, but significantly better than December's peak decline (-36.9% year over year). Pending listings are an early indicator of future sales, which slowed to an annual pace of 4.04 million in August.
- Newly listed homes fell -9.1% compared to September last year, more than August's -7.5% year-over-year drop.
- Regionally, inventory grew slightly in the South, by 1.5% compared to September 2022, but declined year-over-year in the West (-27.7%), Northeast (-12.9%), and Midwest (-6.9%).
- In the 50 largest U.S. metro areas, the number of homes for sale is -41.9% below pre-pandemic levels. Inventory decreased in 36 out of 50 of the largest metros compared to last year, although some Southern metros saw significant growth, such as Memphis, Tenn. (+35.6%), New Orleans (28.4%) and San Antonio (24.4%).
- Among the top 50 metros, San Antonio (+4.4%), and Buffalo, N.Y. (+2.1%) saw new listings increase. Declines in newly listed homes were greatest in Las Vegas (-31.7%), New York, N.Y. (-23.6%) and Detroit, Mich. (-21.9%).
- In September, the typical home spent 48 days on the market, only one day longer than the same time in 2022, but two weeks less than in the average September between 2017 and 2019.
- Regionally, only large metros in the South saw time on market increase on average year-over-year (+1 day). Large metros in the Northeast spent 2 days less on the market, those in the Midwest spent 3 days less on the market, and homes spent 4 days less than last year in the West.
- Time on market increased in 17 of the 50 largest metros, including New Orleans (+11 days), Austin, Texas (+8 days), and Nashville, Tenn. (+6 days).
- Time on market decreased compared to last year in 30 of the 50 largest metro areas. The largest drops were in San Jose, Calif., San Francisco (-9 days), and Sacramento, Calif. (-8 days). This is primarily because this region experienced the most significant slowdown last year when interest rates rose.
Click here to view the report in its entirety.


