
 DSNews The homepage of the servicing industry


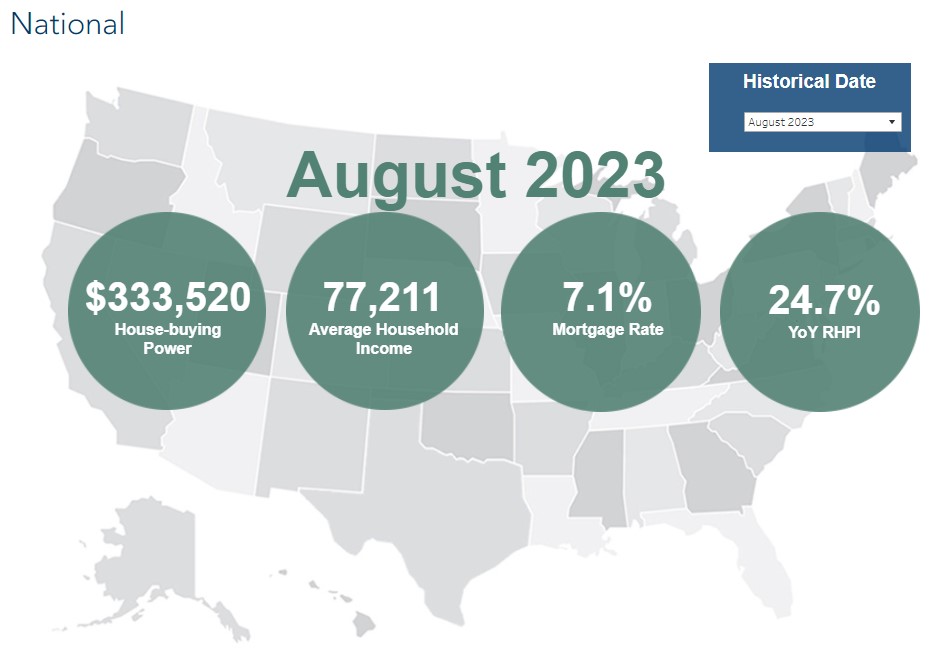
 First American Financial Corporation’s Data & Analytics branch has released it latest update of the of the Real House Price Index (RHPI), covering the month of August 2023, which aims to measure the price changes of single-family properties throughout the country adjusted for the impact of income, nominal interest rates change on consumer house-buying power over time on the national, state, and metropolitan area levels.
Because the RHPI continually adjusts for house-buying power, it also serves as a primary measure of housing affordability.
Overall, First American found that the August RHPI jumped by a significant 25% year-over-year, dragging housing affordability to the lowest level in more than three decades.
“In August 2023, the RHPI jumped up by nearly 25% on an annual basis, dragging housing affordability to the lowest point in over three decades. Two factors drove the sharp annual decline in affordability—a 5.4% annual increase in nominal house prices, according to our First American Data & Analytics House Price Index, and a 1.9 percentage point increase in the 30-year, fixed mortgage rate compared with one year ago,” said Mark Fleming, Chief Economist at First American. “For home buyers, holding prices constant, the only way to mitigate the loss of affordability caused by higher mortgage rates is with an equivalent, if not greater, increase in household income. Even though household income increased 2.9% since August 2022 and boosted consumer house-buying power, it was not enough to offset the affordability loss from higher rates and rising nominal prices.
“House prices reached a new peak in August. For those trying to buy a home, house price appreciation can be intimidating and makes the purchase more expensive, all else held equal. However, once the home is purchased, appreciation helps build equity in the home, and becomes a benefit rather than a cost,” said Fleming. “As potential first-time home buyers consider homeownership in today’s market, they should carefully weigh the costs of owning a home against the cost of renting.”
Looking at the choice between buying and renting, it still remains cheaper to rent versus buying in the current market when factoring in additional home costs such as utilities, insurance, taxes, and maintenance. But the gap between buying and renting is quickly closing in on itself.
“The cost of renting is simply the amount of rent paid every month. The monthly cost of owning a home includes taxes, repairs, homeowner’s insurance and the monthly mortgage principal and interest payments. To calculate the monthly cost of homeownership, our analysis assumes the potential buyer is taking out a 30-year, fixed-rate mortgage with a 5% down payment on a home at the median sale price,” said Fleming. “Finally, our monthly cost-to-own analysis factors in the potential benefit of equity accumulation through house price appreciation as well as the potential cost in terms of lost equity from declining house prices.
“If you simply compare the cost of renting versus the cost of owning without accounting for the benefit or loss from house price changes, it has always been cheaper to rent versus own,” said Fleming. “In fact, nationally, the gap between the cost of owning versus the cost of renting was the widest in over 20 years of data in the third quarter of 2023, due to higher mortgage rates pushing up the monthly cost of homeownership.”
“However, once accounting for house price changes, a different story emerges. It was more financially prudent to own versus rent from 2000 until 2005 as house price appreciation was strong. In other words, the equity gained from house price appreciation meant the house was paying homeowners during this time period,” Fleming continued. “Conversely, as house prices declined from 2006 through 2011, the falling house prices added to the cost to the homeowner, and during that time it made more financial sense to rent.
“This situation reversed in 2012, and house price appreciation once again began to ‘pay’ the homeowner. It wasn’t until the first quarter of this year that the market shifted back in favor of renting. As mortgage rates remained high while house prices slowed in the first and second quarters of 2023, the median monthly cost to own exceeded the cost to rent,” Fleming concluded. “Yet, the gap has since narrowed as house prices re-accelerated in the third quarter of the year. As of the third quarter, the median rent in the U.S. was approximately $1,300, while the median cost of homeownership adjusted for house price appreciation was approximately $1,500.”
Top data points from the report as highlighted by First American, include:
August 2023 Real House Price Index Highlights:
- Real house prices increased 3.0% between July 2023 and August 2023.
- Real house prices increased 24.7% between August 2022 and August 2023.
- Consumer house-buying power, how much one can buy based on changes in income and mortgage rates, decreased 1.9% between July 2023 and August 2023, and decreased 15.5% year over year.
- Median household income has increased 2.9% since August 2022 and 85.8% since January 2000.
- Real house prices are 46.6% more expensive than in January 2000.
- Unadjusted house prices are now 55.1% above the housing boom peak in 2006, while real, house-buying power-adjusted house prices are 2.6% above their 2006 housing boom peak.
August 2023 Real House Price State Highlights:
- The five states with the greatest year-over-year increase in the RHPI are: Alaska (+35.7%), Maine (+34.2%), Connecticut (+33.0%), West Virginia (+31.9%), and Indiana (+30.4%),
- There were no states with a year-over-year decrease in the RHPI.
August 2023 Real House Price Local Market Highlights:
- Among the Core Based Statistical Areas (CBSAs) tracked by First American Data & Analytics, the five markets with the greatest year-over-year increase in the RHPI are: San Diego (+32.7%), Cincinnati (+32.7%), Hartford, Conn. (+32.1%), Boston (+31.2%), and Indianapolis (+30.2%).
- Among the Core Based Statistical Areas (CBSAs) tracked by First American Data & Analytics, there were no markets with a year-over-year decrease in the RHPI.
Click here to see the report in its entirety.


