
 DSNews The homepage of the servicing industry


 Obtaining a mortgage used to be a step in the process of the American Dream: owning a home. However, the COVID-19 Pandemic threw a lot of variables onto the table; increasing interest rates since the ultra-low rates that appeared during the early days of the pandemic, and declining incomes have made attaining the dream even harder.
According to Creditnews Research, mortgage affordability today is the worst it has been since 1981 when mortgage rates hit a record high of 18.38%. But how can this be when current rates are less than half that?
The term used to describe this phenomenon is called a “mortgage burden,” and for the average homebuyer, the mortgage burden is the ratio of mortgage payments to income—the higher the ratio, the less affordable it is to own a home.
Research from Creditnews found that the average mortgage burden (or percentage of income that goes towards your mortgage) has more than doubled since the start of Covid and is significantly higher than at any point since the early 1980s, when interest rates averaged 18%.
Mortgage costs have far outpaced real income growth, making it even harder for the average American to finance a home and manage the monthly payments.
“The average American has seen their purchasing power decline rapidly since the pandemic, and nowhere is this more evident than housing. In terms of mortgage burden, the average house today is almost as unaffordable as it was in 1981 when mortgage rates were more than double what they are currently,” said Sam Bourgi, Senior Credit Analyst at Creditnews. “To buy a home at current home prices and interest rates, the average American family would spend more than half their monthly income on mortgage payments alone. This far exceeds the 30% threshold recommended by the Department of Housing and Urban Development.”
Key takeaways from the report as highlighted by Creditnews include:
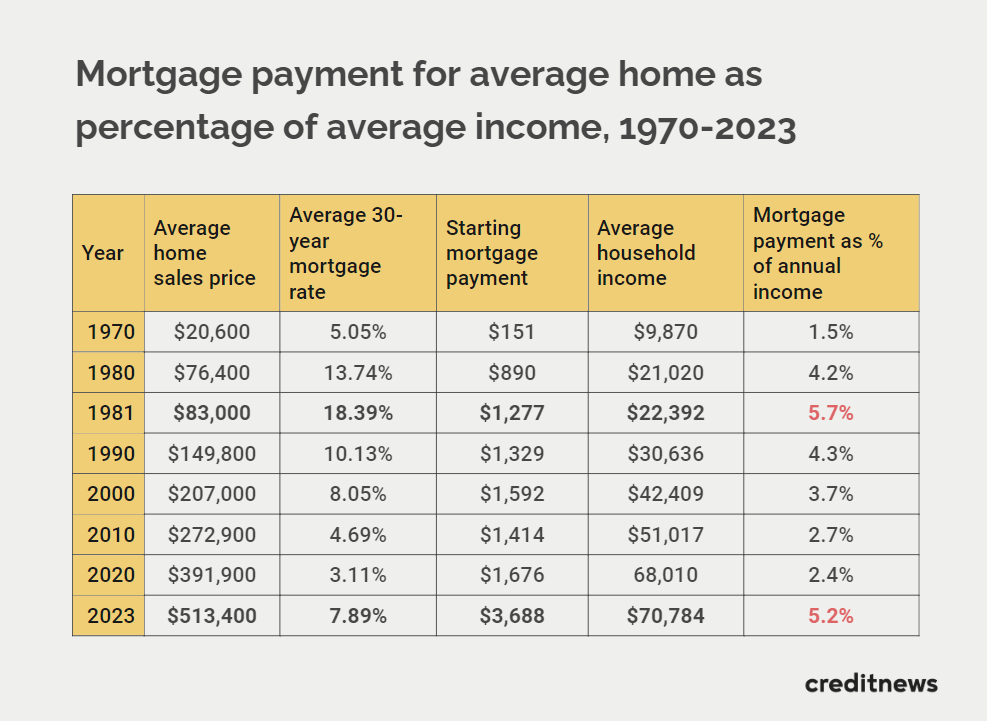
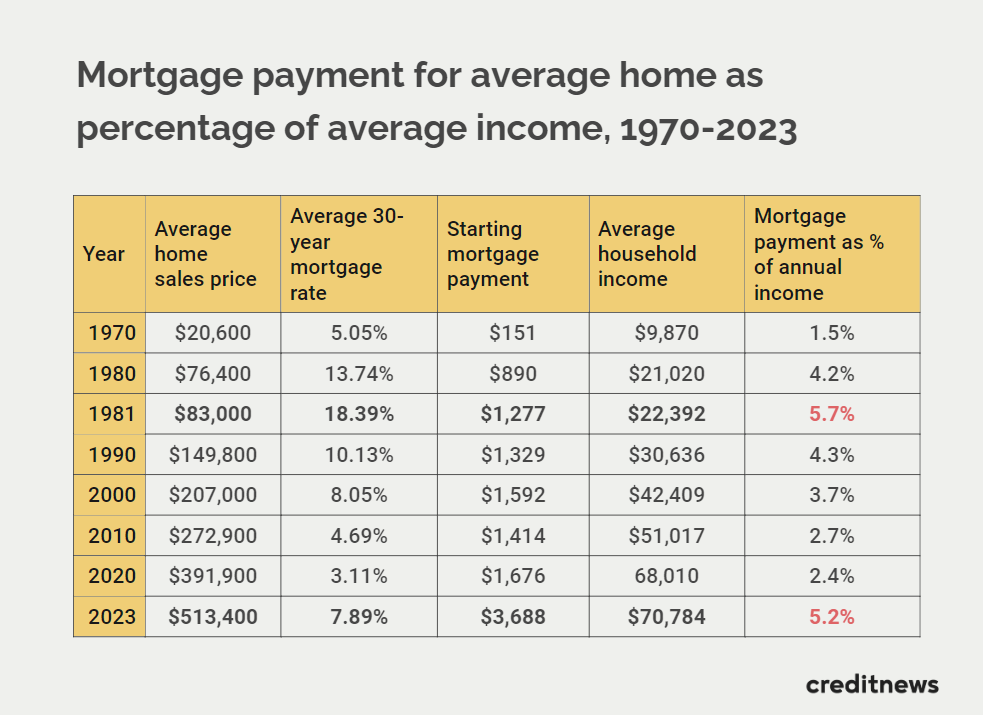
- In terms of mortgage burden, an average-priced house in 2023 is almost as unaffordable as in 1981 when mortgage rates peaked at 18.39%. Using the same metric, an average house today is more than two times costlier than it was in 2020;
- At current rates, the average household could spend more than 60% of its monthly income on mortgage payments, assuming a 10% down payment. Anything above 50% is considered a severe cost burden;
- While house prices have moderated from last year’s highs, a typical household still needs 7.25 years’ worth of income to afford an average house. That’s the second-highest on record. By comparison, it took the average household 3.7 years to afford an average house in 1981;
- Low mortgage affordability leads to the “golden handcuffs” phenomenon—which is one of the biggest underlying factors behind the post-Covid housing shortage.
The world in 1980 was a very different landscape than it is today. Interest rates hit 19%, and multiple recessions hit in less than two years.
At the rates the market was at during that time, homeownership was out of reach for the majority of people—the typical mortgage cost about $1,277 per month, and its mortgage burden was 5.7% of annual income—the highest level ever recorded.
One year earlier, in 1980, the average mortgage rate was 13.74%, and the typical mortgage burden was 4.2%—still high by historical standards.
Former Fed Chairman Paul Volcker forced interest rate hikes successfully brought inflation under control, which the Fed then normalized over the next 30 years.
As rates declined throughout that time, home prices grew modestly, the average mortgage burden fell through the 1990s to 2010s, even during the height of the subprime mortgage crisis.
In 2020, just before Covid, the mortgage burden stood at 2.4% of annual income. That’s when everything changed.
As the pandemic began, the market were in a tizzy and to relieve pressure, the Fed held an emergency meeting to bring interest rates to near zero. Since then, it has raised rates 11 times to the current nominal interest rate of 5.50%.
Today, the average 30-year mortgage rate reached a two-decade high of around 7.79%. And although the average home sale price declined from its peaks, averages remain well above $500,000.
Meanwhile, starting mortgage payments for new homebuyers swelled to $3,568 a month from $1,676 before the pandemic, bringing the average mortgage burden to 5.2%—the highest since 1981. In other words, starting mortgage payments more than doubled between 2020-2023, while average household income grew just 4.1%.
According to Creditnews, at current rates, the average household could spend more than 60% of its monthly income on mortgage payments, assuming a 10% down payment. According to the U.S. Department of Housing and Urban Development, households are considered “cost-burdened” when they spend in excess of 30% of their monthly income on housing. Anything above 50% is considered a severe cost burden.
The decline in housing affordability isn’t limited to mortgage burden, either.
Creditnews also compared average household incomes to home prices to determine how many years of income the average American family needed to buy a house.
In 1981, the average household income was $22,392, and it took 3.7 years of income to afford the typical house. By 2023, the average household income stood at $70,784, and it took 7.25 years’ worth of income to afford the average home.
The lack of affordable housing has lead to major problems in the economy and especially for first-time buyers.
For one, new homeowners who purchased homes before 2022 are locked into ultra-cheap mortgages as low as 3.3%.
Creditnews estimates that two-thirds of homeowners now have an interest rate below 4%, thanks to ultra-low rates seen during the pandemic. This has led to the “lock-in effect” where homeowners with these ultra-low rates do not want to sell homes because they do not want to take out a new mortgage at today’s rates.
This in itself has nearly frozen the market due to limited available inventory. In May 2023, housing inventory across the U.S. fell to just under 1.4 million houses, the lowest since record-keeping began. In January 2019, before the pandemic, the supply was 2.2 million houses.
Research from Freddie Mac suggests the U.S. needs 3.8 million more houses to alleviate the housing shortage.
Click here to view the data in its entirety.


