
 DSNews The homepage of the servicing industry


At the close of Q3 of 2023, the national single-family rental (SFR) market displayed a consistent pattern of year-over-year growth in the median number of listings, prices, and days on market, according to HouseCanary's State of the Single-Family Rental Market.
Despite a relative slowdown in rate hikes from the Federal Reserve compared to H1 2023, lingering market uncertainties have propelled potential homebuyers towards the rental sector as a means to mitigate risks associated with property investments.
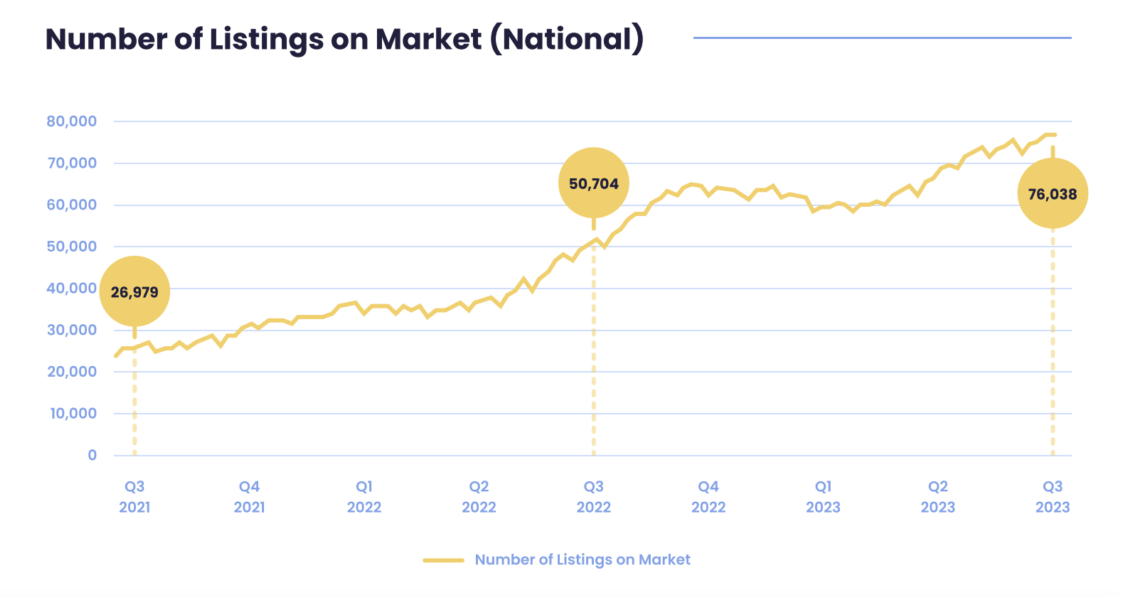
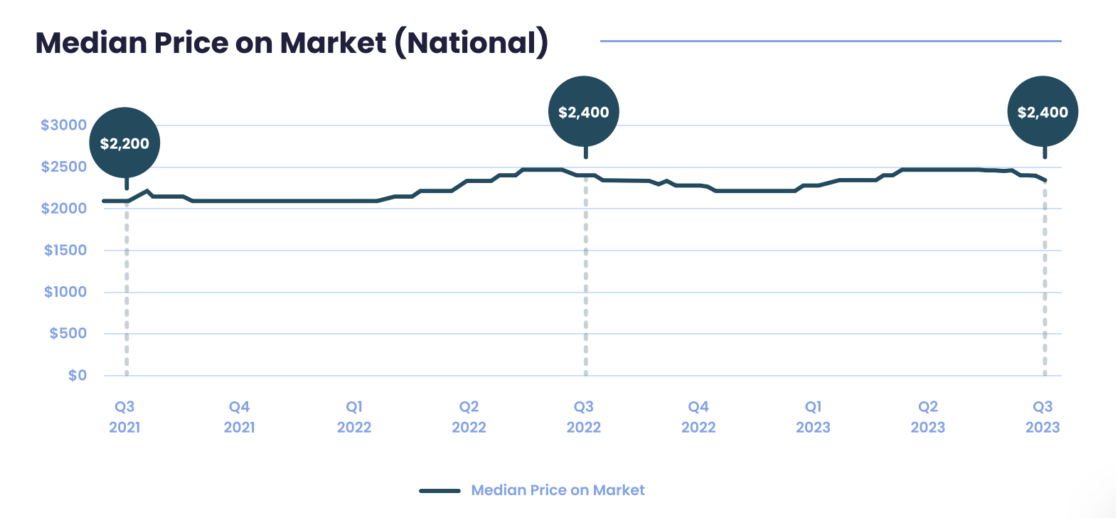
Much like the preceding quarter, Q3 2023 saw only a marginal year-over-year increase in median SFR prices. This trend can be attributed to a surplus of available-for-rent inventory, as evidenced by a notable 31.5% surge compared to the previous year. Additionally, the average days on market expanded by 28.4% year-over-year, indicating that rental properties are staying listed for extended durations compared to the same period last year.
Forecasts aligning with HouseCanary's Q2 2023 predictions suggest that median SFR prices may have reached their peak, with limited room for further increases.
Federal Reserve officials and industry experts anticipate that while rate hikes will continue, they will likely be smaller increases than we have seen throughout this year, fostering a more favorable market environment for purchasing activity to gain momentum. Moreover, the initiation of student loan repayments in October is expected to have a future downward influence on interest rates as inflation responds to consumers having less discretionary income.
National Analytics Snapshot for Single-Family Listings – End of Q3 2023:
In Q3 2023, on average, median prices for rental properties witnessed a 0.7% upswing compared to the corresponding period in 2022. Correspondingly, median inventory experienced a substantial 31.5% increase year-over-year, while median Days on Market and median inventory demonstrated a significant surge of 28.4% compared to Q3 2022. This data reinforces the evolving dynamics of the SFR market, urging stakeholders to adapt strategies accordingly.
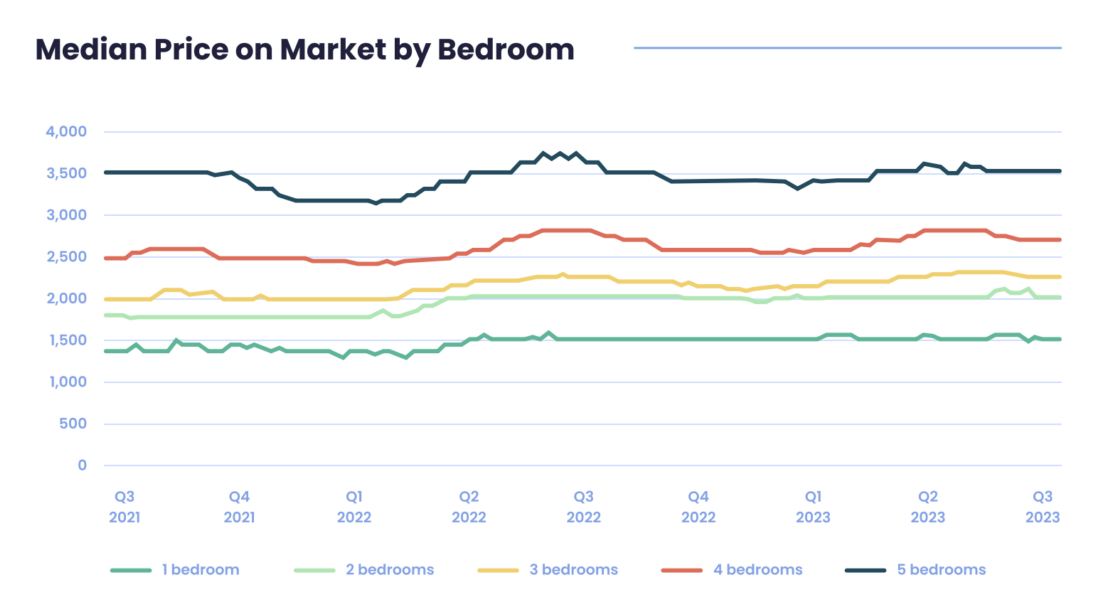
In Q3 2023, rental properties stayed on the market for an average of 27.1 days, a 28.4% increase since the same period in 2022 and an 11.1% increase since Q2 2023. Due to the increasing supply, the median price for the last week of Q3 2023 was unchanged as compared to the same week a year ago. Besides 4-bedroom and 5-bedroom units, all other rentals saw slight year-over-year increases in price, with the highest increase being 3-bedroom units, which saw a 1.88% year-over-year increase.
Largest Annual Increase: Average Days on Market
As noted in HouseCanary's Q2 Rental Report, rental inventory has increased significantly over the past two years, and many MSAs continue to see large increases in average days on market. Raleigh, North Carolina, which saw the highest increase in Days on Market of +281%, also saw the highest increase in available rental inventory compared to Q3 2022. Naturally, a massive influx of new rental properties has also led to a longer average time on the market. The southern regions of the U.S. are seeing the most significant increases in average days on market.
Of the top 10 MSAs in this metric, five are located in the South, with the other five located in Florida. Overall, median days on market are up 28.4% compared to Q3 2022.
Largest Annual Decrease: Average Days on Market
Increased rental availability across the board means that very few MSAs are seeing decreases in average days on market. Of the MSAs HouseCanary observed, only Clarksville, Tennessee, saw a decrease in average days on market on a year-over-year basis. Clarkesville also has the 9th-cheapest median rental price of observed MSAs. On average, median days on market in Q3 2023 increased by 28.4% compared to Q3 2022.
Largest Annual Increase: Inventory Average
Many MSAs have seen increases of over 100% in rental inventory average over the past year, pointing to a housing market pullback due to high interest rates and other factors. Rental inventory continues to increase rapidly across the housing market. Last quarter, Raleigh saw the third-largest increase in inventory average. Since then, Raleigh has shot to the top of the list, seeing an increase in inventory average of 244% on a year-over-year basis.
Very few MSAs saw significant decreases in inventory averages over the last year. Only 4 MSAs saw any decrease at all, with Birmingham, Alabama, and Shreveport, Louisiana, seeing the most significant decreases of -30% and -19%, respectively. The vast majority of MSAs, however, continued to see growth in available inventory, continuing the trend that we have seen throughout the year.
Largest Annual Increase: Median Monthly Single-Family Rental Listing Price
Through analyzing MSA-level data, it's evident that the 10 MSAs listed below recorded the most substantial year-over-year upswings in single-family rental prices. In Q3 2023, a notable shift occurred when the regions with the highest price increases transitioned from the Midwest to the East Coast. Noteworthy among these shifts were Charlottesville, Virginia, and Shreveport-Bossier City, Louisiana, both experiencing remarkable surges in rental prices.
Additionally, areas like Jackson, Missouri, followed a consistent pattern observed since Q1 2023, where rents in growing, cost-effective metropolitan regions continue to rise.
Despite the overall national trend of year-over-year price increases, certain MSAs have shown declines in price. Leading this list is Punta Gorda, Florida, with a notable 8.2% decrease compared to the previous year. Of particular significance, Memphis, Tennessee, has experienced a substantial drop in rental prices over the past year, registering an 8.1% decrease from the same period last year. Moreover, five out of the 10 most substantial year-over-year price reductions occurred in Southern MSAs, further highlighting this regional trend.
Most Expensive in Q3 2023: Median Monthly Single-Family Rental Prices
As Q3 2023 progresses, California's MSAs continue to dominate the list of the highest rental prices. Notably, San Diego-Carlsbad, California, has now surpassed Los Angeles-Long Beach-Anaheim, California, as the priciest MSA in the nation. Given the persistently high prices and interest rates, rental properties continue to be an appealing option for prospective buyers who are still facing barriers to entry into the housing market.
Consequently, it is unlikely that substantial decreases in these rental prices will be seen anytime soon. This underscores the ongoing demand for rental properties in the face of challenging market conditions.
To read the full report, including more data, charts, and methodology, click here.


