
 DSNews The homepage of the servicing industry


On average, roughly one in 15 (6.5%) U.S. homes for sale had a price drop during the four weeks ending September 24, up from 5.8% a month earlier—a sharp monthly increase compared to the same period in years past.
That’s according to a new report from Redfin, which showed that at the same time, the median home-sale price is up an estimated 3% year-over-year. The typical homebuyer’s monthly payment is now at a record high as mortgage rates remain elevated, with daily average rates hitting a two-decade high on September 27.
Leading indicators of homebuying demand and activity:
- As of Sept. 27, the daily average 30-year fixed mortgage rate was 7.65%, representing the highest level in over two decades and up from an estimated 6.8%, according to Mortgage News Daily.
- The weekly average 30-year fixed mortgage rate was 7.19% for the week ending Sept. 21, remaining flat from 7.18% a week earlier and up from 6.29%, according to Freddie Mac.
- Mortgage-purchase applications were down 2% from a week earlier (as of the week ending Sept. 22), down approximately 27%, according to the Mortgage Banker's Association (MBA).
- The Redfin Homebuyer Demand Index was down 6% from a month earlier (as of the 4 weeks ending Sept. 24), down 7%, and close to its lowest level since January.
- Google searches for “home for sale" were down 8% from a month earlier as of Sept. 23, representing a 12% decrease, according to Google Trends.
Metros with biggest year-over-year increases in median sale price:
- Anaheim, CA (14.2%)
- San Jose, CA (10.6%)
- Fort Lauderdale, FL (10.5%)
- New Brunswick, NJ (10%)
- Newark, NJ (9.8%)
Metros with biggest year-over-year declines in median sale price:
- Austin, TX (-4.4%)
- Houston (-2.2%)
- San Antonio (-1.7%)
- Fort Worth, TX (-1.6%)
- Las Vegas (-1%)
The U.S. median sale price declined in a total of 8 metros, with Phoenix (-1%), Nashville, TN (-0.7%), and Dallas (-0.1%) rounding out the bottom three metros with biggest year-over-year declines.
Metros with biggest year-over-year increases in new listings:
- San Jose, CA (7.2%)
- West Palm Beach, FL (4.1%)
- Miami (3.6%)
- Cleveland (3.6%)
- San Antonio (3.3%)
New listings declined in all but 10 U.S. metros, with Cincinnati (2.8%), Minneapolis (1%), Pittsburgh (0.7%), Houston (0.5%), and Fort Lauderdale, FL (0.1%) rounding out the bottom five on the list with the largest year-over-year increases.
Metros with biggest year-over-year declines in new listings:
- Atlanta (-30%)
- Las Vegas (-17.7%)
- Riverside, CA (-17.6%)
- Portland, OR (-16.4%)
- Newark, NJ (-16.2%)

U.S. Highlights
Key housing market data for the four weeks ending Sept. 24, 2023:
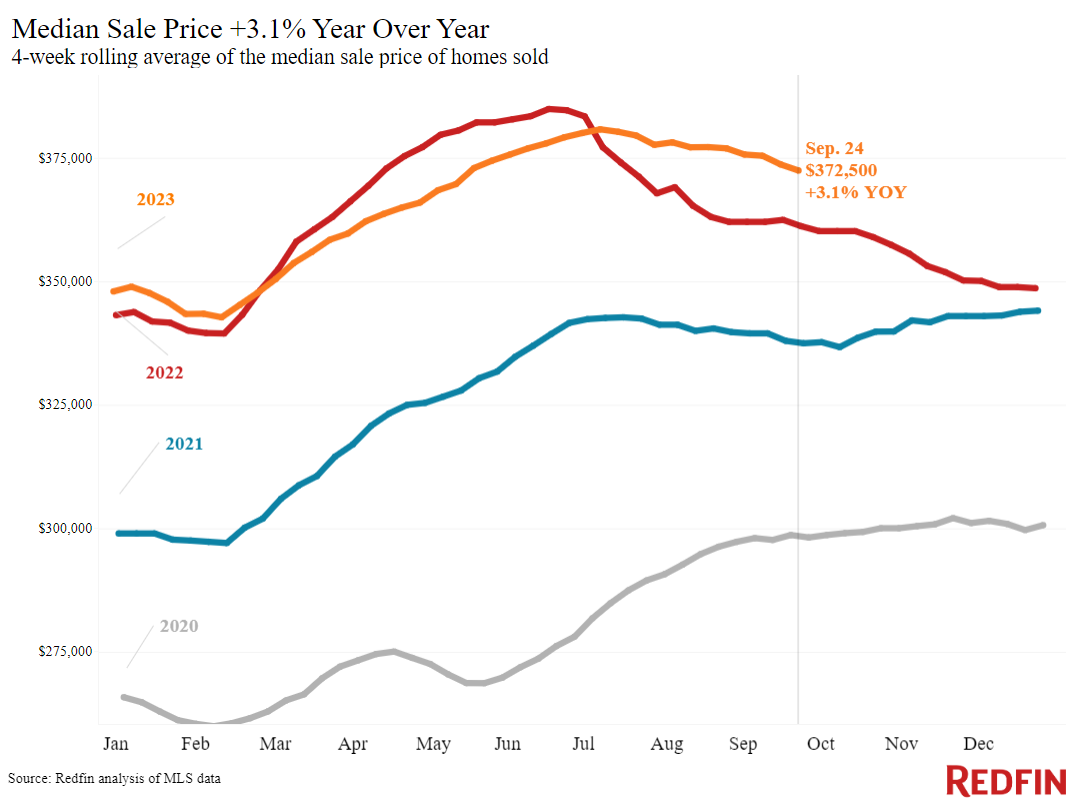
- The median sale price was $372,500, representing a 3.1% year-over-year change. Median sale prices are up partly because elevated mortgage rates were hampering prices during this time last year.
- The median asking price was $387,350, representing a 4.4% year-over-year change, the biggest increase since October 2022.
- The median monthly mortgage payment was $2,666 at a 7.19% mortgage rate, representing an 8.5% year-over-year change and reaching an all-time high.
- Pending sales totaled 76,294, representing a -13% decline.
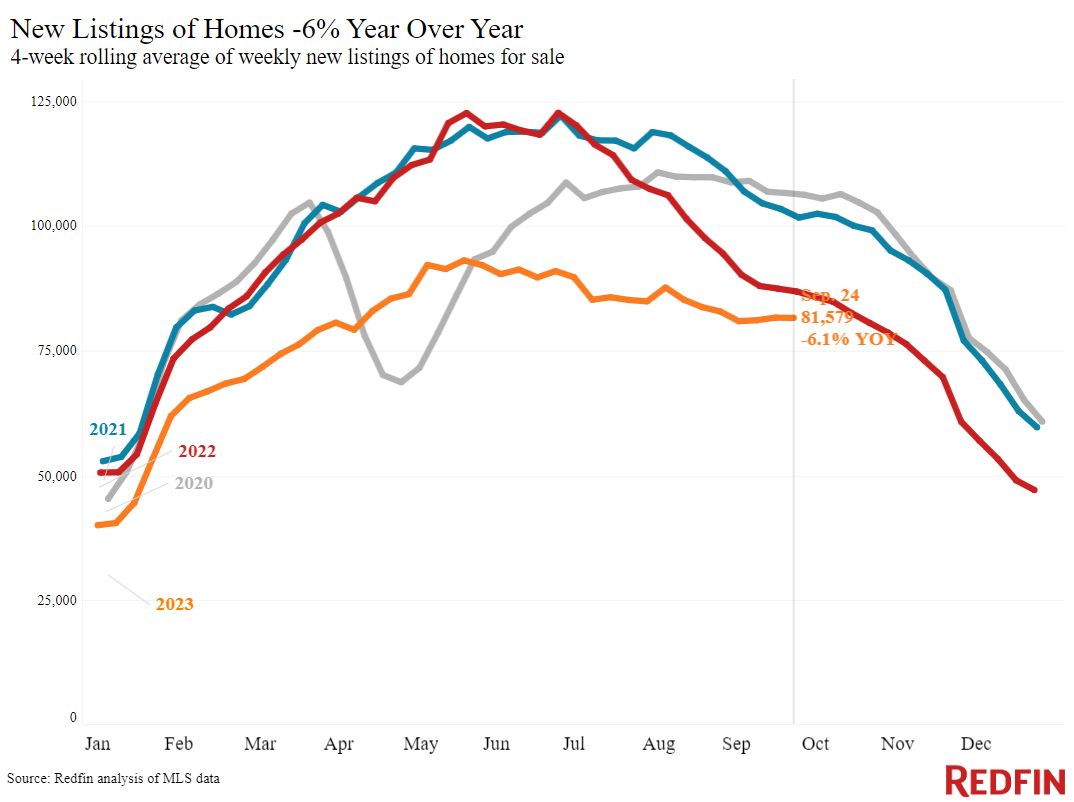
- New listings totaled 81,579, down 6.1%, representing the smallest decline in over a year.
- Active listings totaled 811,325, representing a -15.3% decline.
- Months of supply averaged 3.2 months, up +0.1 percentage point year-over-year, marking the highest level since February. Roughly 4 to 5 months of supply are considered balanced, with a lower number indicating seller’s market conditions.
- The share of homes off the market in two weeks rose to 38.8%, up from 35% year-over-year.
- Median days on market were 31 days, down an estimated one day year-over-year.
- The share of homes sold above list price remained unchanged at 31.8%.
- The share of homes with a price drop was 6.5%, up +0.2 percentage points year-over-year, representing the highest share since November 2022.
- The average sale-to-list price ratio was 99.4%, up +0.2 percentage points year-over-year.
To read the full report, including more data, charts, and methodology, click here.


