
 DSNews The homepage of the servicing industry


 According to Black Knight’s “first look” at September 2022 month-end mortgage performance data, prepayment activity dropped by 14.9% to a single-month mortality rate of 0.57% over the course of the month, now at its lowest level since November 2000.
In addition, the national delinquency rate inched down by two-tenths of a percentage point from August to 2.78%, just north of the record low set in May 22, as the bulk of past-due mortgages held relatively steady.
The number of borrowers who are behind by a single payment rose by 1%, while those 90-days past due fell 1.5%, and foreclosure starts fell 9% from August to 18,400 starts, a number now 53% below pre-pandemic levels.
By the numbers:
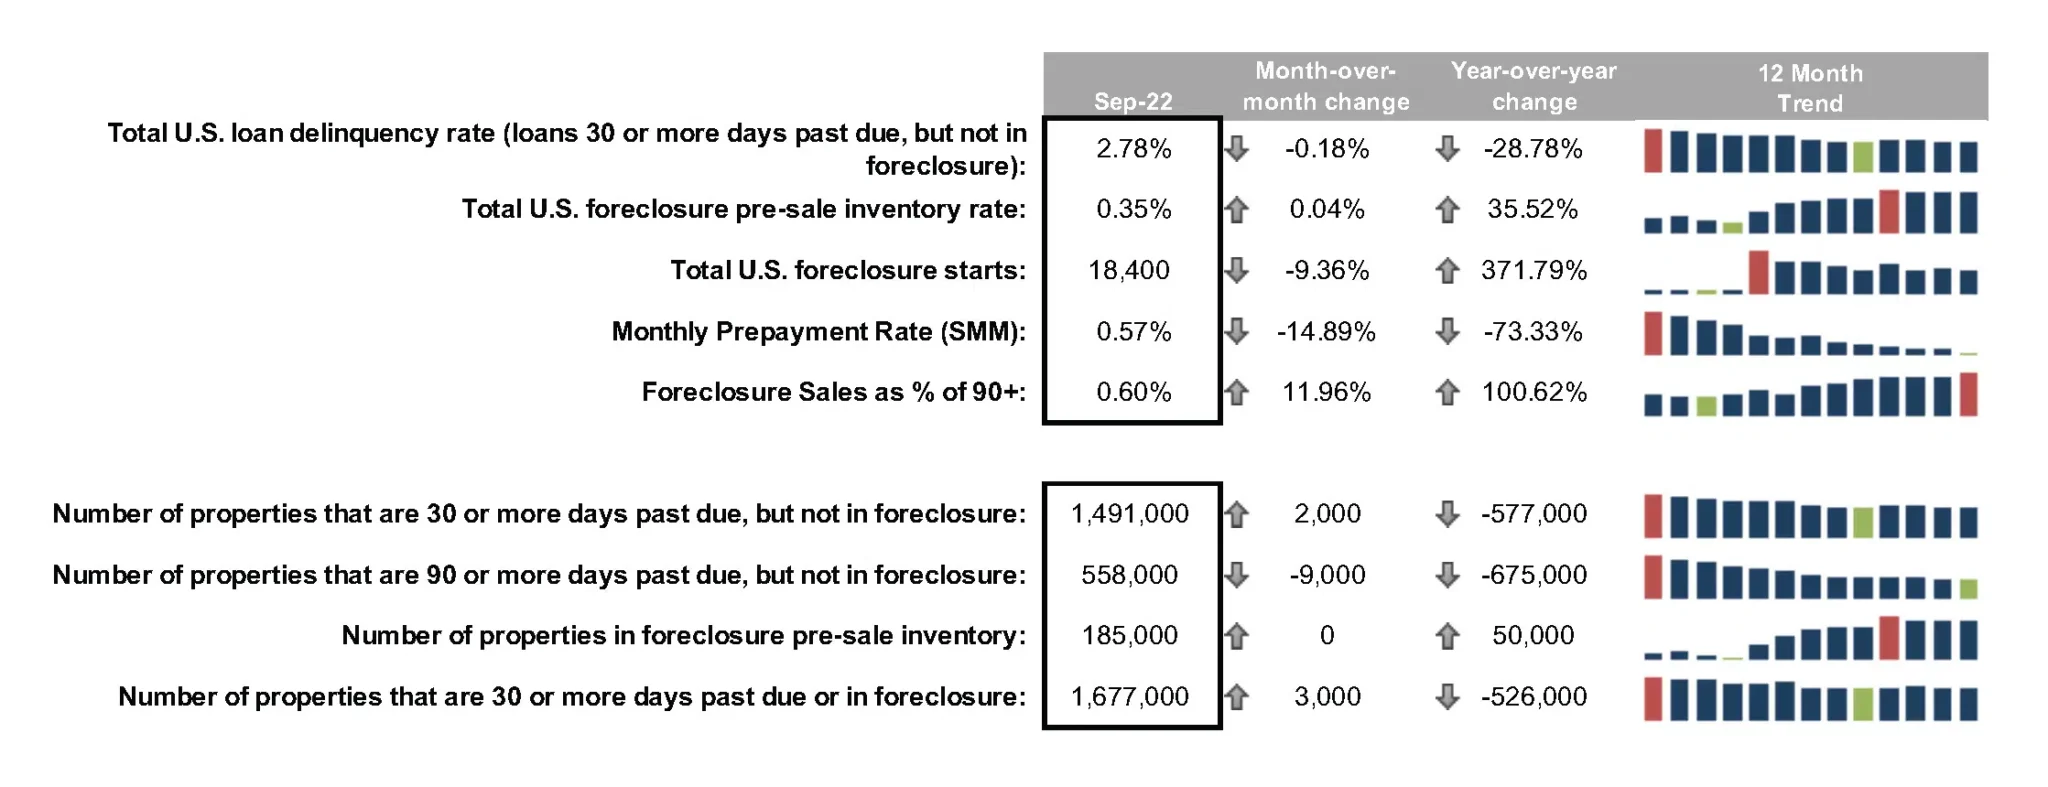
Total U.S. loan delinquency rate (loans 30 or more days past due, but not in foreclosure): 2.78%
Month-over-month change: -0.18%
Year-over-year change: -28.78%
Total U.S. foreclosure pre-sale inventory rate: 0.35%
Month-over-month change: 0.04%
Year-over-year change: 35.52%
Total U.S. foreclosure starts: 18,400
Month-over-month change: -9.36%
Year-over-year change: 371.79%
Monthly prepayment rate (SMM): 0.57%
Month-over-month change: -14.89%
Year-over-year change: -73.33%
Foreclosure sales as % of 90+: 0.60%
Month-over-month change: 11.96%
Year-over-year change: 100.62%
Number of properties that are 30 or more days past due, but not in foreclosure: 1,491,000
Month-over-month change: 2,000
Year-over-year change: -577,000
Number of properties that are 90 or more days past due, but not in foreclosure: 558,000
Month-over-month change: -9,000
Year-over-year change: -675,000
Number of properties in foreclosure pre-sale inventory: 185,000
Month-over-month change: 0
Year-over-year change: 50,000
Number of properties that are 30 or more days past due or in foreclosure: 1,677,000
Month-over-month change: 3,000
Year-over-year change: -526,000
Top 5 States by Non-Current Percentage:
Mississippi: 6.39 %
Louisiana: 5.62 %
Oklahoma: 4.68 %
Alabama: 4.56 %
West Virginia: 4.46 %
Bottom 5 States by Non-Current Percentage:
Oregon: 1.93 %
Colorado: 1.79 %
California: 1.78 %
Idaho: 1.68 %
Washington: 1.64 %
Top 5 States by 90+ Days Delinquent Percentage:
Mississippi: 2.39 %
Louisiana: 1.95 %
Alabama: 1.67 %
Oklahoma: 1.54 %
Arkansas: 1.51 %
Top 5 States by 6-Month Change in Non-Current Percentage:
Alaska: -24.31 %
Hawaii: -23.06 %
North Dakota: -15.09 %
New York: -14.00 %
District of Columbia: -10.19 %
Bottom 5 States by 6-Month Change in Non-Current Percentage:
South Dakota: 10.09 %
Iowa: 8.39 %
Arizona: 6.54 %
Kansas: 6.28 %
Wyoming: 4.99 %


