
 DSNews The homepage of the servicing industry


 According to Black Knight’s “first look” at October 2022 month-end mortgage performance data, prepayments fell to a record low of 0.48%, well below the previous record of 0.55% and the lowest since Black Knight began reporting this metric in 2000.
Looking at delinquencies, the national rate rose 4.5% to 2.91%, up 12 basis points from September, which was mostly driven by a 9.4% rise in 30-day delinquencies. Loans that were 60-days past due were up 2.9% in October while mortgages 90-days past due saw continued improvement over the last few months dropping 1.5%.
Florida led the nation in the 19,000 loan jump in early delinquencies, indicating early numbers of homeowners who stopped paying their mortgages due to damage or destruction from Hurricane Ian.
Foreclosure starts came in at 19,600—representing a 7% increase—but still remain 55% below numbers reported before the COVID-19 pandemic.
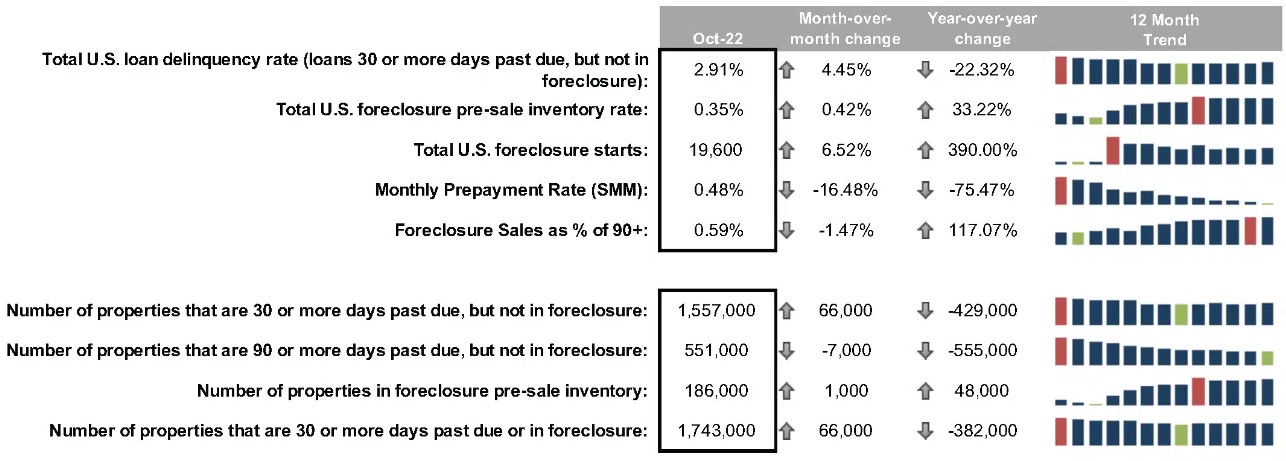
By the numbers:
Total U.S. loan delinquency rate (loans 30 or more days past due, but not in foreclosure): 2.91%
Month-over-month change: 4.45%
Year-over-year change: -22.32%
Total U.S. foreclosure pre-sale inventory rate: 0.35%
Month-over-month change: 0.42%
Year-over-year change: 33.22%
Total U.S. foreclosure starts: 19,600
Month-over-month change: 6.52%
Year-over-year change: 390.00%
Monthly prepayment rate (SMM): 0.48%
Month-over-month change: -16.48%
Year-over-year change: -75.47%
Foreclosure sales as % of 90+: 0.59%
Month-over-month change: -1.47%
Year-over-year change: 117.07%
Number of properties that are 30 or more days past due, but not in foreclosure: 1,557,000
Month-over-month change: 66,000
Year-over-year change: -429,000
Number of properties that are 90 or more days past due, but not in foreclosure: 551,000
Month-over-month change: -7,000
Year-over-year change: -555,000
Number of properties in foreclosure pre-sale inventory: 186,000
Month-over-month change: 1,000
Year-over-year change: 48,000
Number of properties that are 30 or more days past due or in foreclosure: 1,743,000
Month-over-month change: 66,000
Year-over-year change: -382,000
Top 5 States by Non-Current Percentage
Mississippi: 6.50%
Louisiana: 5.75%
Oklahoma: 4.88%
Alabama: 4.64%
West Virginia: 4.47%
Bottom 5 States by Non-Current Percentage
Colorado: 2.05%
Oregon: 1.99%
California: 1.84%
Idaho: 1.74%
Washington: 1.67%
Top 5 States by 90+ Days Delinquent Percentage
Mississippi: 2.38%
Louisiana: 1.90%
Alabama: 1.66%
Oklahoma: 1.55%
Arkansas: 1.54%
Top 5 States by 6-Month Change in Non-Current* Percentage
Alaska: -23.82%
Hawaii: -20.35%
New York: -14.00%
North Dakota:-10.47%
New Jersey: -3.13%
Bottom 5 States by 6-Month Change in Non-Current* Percentage
Iowa: 22.96%
Florida: 16.80%
Colorado: 15.91%
South Dakota: 13.12%
Arizona: 12.43%
Click here to view the report in its entirety.


