
 DSNews The homepage of the servicing industry


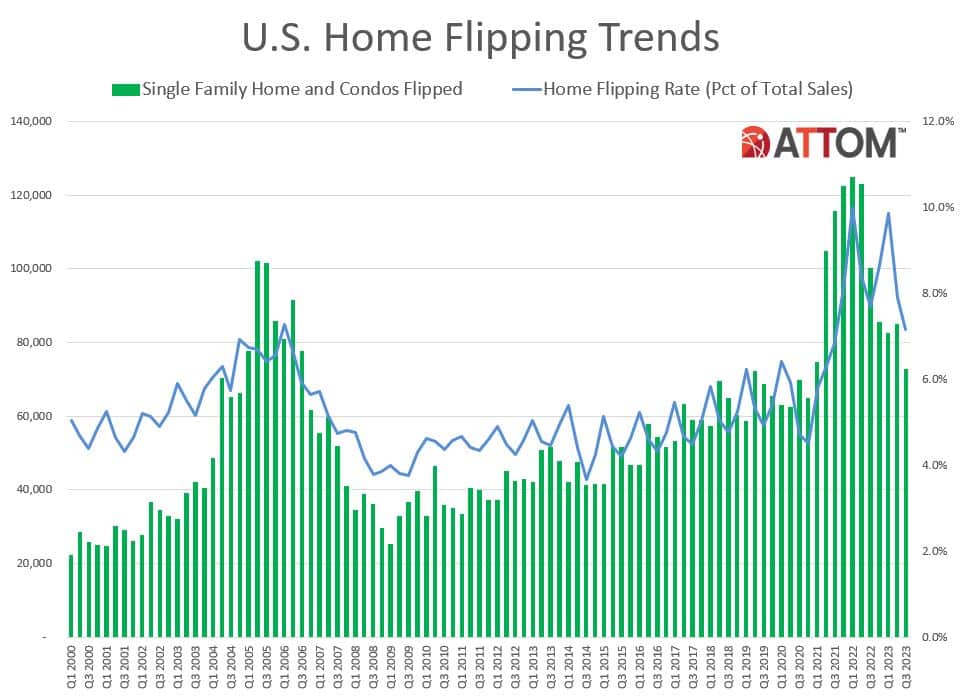
 ATTOM has released its third-quarter 2023 U.S. Home Flipping Report showing that 72,543 single-family homes and condominiums in the U.S. were flipped in the third quarter. Those transactions represented 7.2%, or one of every 14 home sales nationwide, during the months running from July through September of 2023.
The latest portion was down from 7.9% of all home sales in the U.S. during Q2 of 2023 and from 7.7% in Q3 of last year. While the flipping rate remained historically high, it dropped for the second straight quarter, to the lowest point in two years.
Even as flipping rates declined, the latest analysis also revealed that fortunes continued improving for home flippers during Q3 in the form of rising profits. Investor returns increased for the third quarter in a row, rebounding from a slump that had slashed profit margins by nearly two-thirds from early-2021 to late-2022. Margins, along with raw profits, rose to the highest levels since the middle of last year.
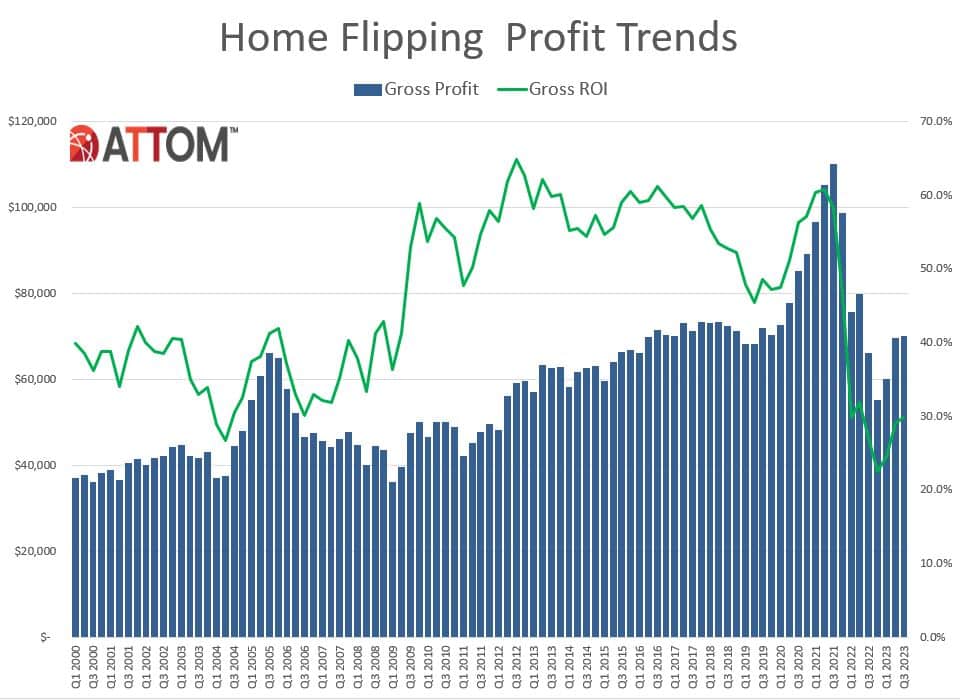
The typical Q3 profit margin of 29.8% nationwide–based on the difference between the median purchase and median resale price for home flips–remained far below peaks hit in 2021, but it was up from 29% in Q2 of 2023, and up seven percentage points from a low of 22.4% in the fourth quarter of last year.
Raw profits on typical flips around the country, meanwhile, increased to $70,000. That remained well down from a high of $110,000 reached in 2021. But it was up slightly from Q2 of 2023, and was $15,000 more than last year's low point.
"The comeback for the home-flipping industry is looking more like a real trend than a temporary break in what had been a pretty bleak couple of years," said Rob Barber, CEO for ATTOM. "For sure, investment returns still aren't anywhere close to where they were a couple of years ago. The latest nationwide profit margin also remains barely within the spread that covers the usual holding costs on flips, with wide variations around the country. Nevertheless, home flippers continue to head back in the right direction."
Profits and profit margins again turned upward in Q3 of 2023, as investors were able to benefit from shifts in prices that went in their favor from the time when they were buying their properties to the point at which they sold them.
Specifically, the typical resale price on flipped homes decreased to $305,000 in Q3, a 1.5% decline from Q2 of 2023. But that drop-off was not as much as a 2.1% dip in median prices that recent home flippers were commonly seeing when they were buying their properties. The smaller quarterly decline in resale prices led to the improvement in profits and profit margins.
Home flips as a portion of all home sales decreased from Q2 of 2023 to Q3 of 2023 in 136 of the 183 metropolitan statistical areas around the U.S. with enough data to analyze (74%). Most of the declines were by less than two percentage points.
Among those metros, the largest flipping rates during Q3 of 2023 were found in:
- Macon, Georgia (flips comprised 16.1% of all home sales)
- Salisbury, Maryland (flips comprised 14.1% of all home sales)
- Spartanburg, South Carolina (flips comprised 13.3% of all home sales)
- Atlanta (flips comprised 13.2% of all home sales)
- Fayetteville, North Carolina (flips comprised 12.8% of all home sales)
Aside from Atlanta, the largest flipping rates among metro areas with a population of more than one million were found in:
- Memphis, Tennessee (12.5%)
- Jacksonville, Florida (10.8%)
- Phoenix (10.4%)
- Cincinnati (10.2%)
The smallest home-flipping rates among metro areas analyzed in Q3 were found in:
- Seattle (3.8%)
- Madison, Wisconsin (3.9%)
- Honolulu (3.9%)
- Bridgeport, Connecticut (4%)
- Lansing, Michigan (4.1%)
Regionally, the highest Q3 flipping rate was reported in the South (9.1%), followed by the West (8.1%), Midwest (6.5%), and Northeast (5.2%).
The median $305,000 resale price of homes flipped nationwide in Q3 of 2023 generated a gross profit of $70,000 above the median investor purchase price of $235,000. That resulted in a typical 29.8% profit margin in Q3 of 2023, up from 29% in Q2 of this year, and 27% in Q3 of last year (as well as the recent low point of 22.4% in Q4 of 2022). But the latest nationwide figure still remained far beneath the 60.8% level reported in Q2 of 2021.
Profit margins went up from the second to the third quarter in 93 of the 183 metro areas analyzed (51%) and were up annually in 111 of those markets, or 61%.
The biggest year-over-year increases in typical profit margins during Q3 were reported in:
- Akron, Ohio (ROI up from 505 in Q3 of 2022 to 114.1% in Q3 of 2023)
- Flint, Michigan (up from 61.6% to 113.8%)
- Canton, Ohio (up from 17.8% to 69.6%)
- Augusta, Georgia (up from 44.8% to 93.5%)
- York, Pennsylvania (up from 61.5% to 107.5%)
The biggest annual increases in typical profit margins among metro areas with a population of at least one million were found in:
- Birmingham, Alabama (ROI up from 35.4% in Q3 of 2022 to 71.9% in Q3 of 2023)
- Buffalo, New York (up from 75.6% to 109.7%)
- Cleveland, Ohio (up from 35.8% to 67%)
- Cincinnati, Ohio (up from 33.5% to 55.3%)
- Tulsa, Oklahoma (up from 32.3% to 53.8%)
The recent gains resulted in typical profit margins of below 30% in just 68, or about a third, of the 183 metros with enough data to analyze in Q3 of 2023. That was far better than a year earlier, when half of those metro areas commonly had investment returns that low.
Metro areas with a population of at least one million and the weakest returns on typical home flips in Q3 of 2023 were reported in:
- Austin, Texas (1.2%)
- Dallas (4.9%)
- San Antonio, Texas (5.7%)
- Houston, Texas (8.1%)
- Salt Lake City, Utah (11.2%)
The highest raw profits on median-priced home flips in the third quarter of 2023, measured in dollars, were concentrated in the West and Northeast regions of the country. Twenty of the top 25 were in those regions, led by:
- San Jose (typical gross profit of $355,000)
- San Francisco ($249,000)
- Salisbury, Maryland ($231,015)
- San Diego ($189,000)
- Bridgeport, Connecticut and New York, New York ($165,000)
The South dominated the opposite end of the range, along with the West. Those two regions had 24 of the 25 worst raw profits on median-priced transactions during Q3. The weakest numbers were recorded in:
- Albuquerque, New Mexico ($1,875 loss)
- Tyler, Texas ($1,749 profit)
- Provo, Utah ($2,120 profit)
- Austin, Texas ($4,939 profit)
- Beaumont, Texas ($6,062 profit)
Nationwide, 62.9% of homes flipped in Q3 of 2023 had been purchased by investors with cash. That was up from 62.3% in Q2 of 2023, although still down from 63.7% portion in Q3 of 2022. Meanwhile, 37.1% of homes flipped in Q3 of 2023 had been bought with financing, down from 37.7% in the prior quarter, but still up from 36.3% a year earlier.
"All-cash flipping inched up a bit as average home mortgage rates rose by a full percentage point across the country during the third quarter following some small drop-offs earlier in 2023," Barber noted. "With rates now dipping back down, the pressure to finance flips with cash is receding a bit. That could lead more investors back to financing their purchases, much as they did when rates were super low a couple of years ago."
Among metropolitan areas with a population of one million or more and sufficient data to analyze, those with the highest percentage of homes flipped in Q3 of 2023 that had been purchased with cash were found in:
- Detroit (79.7%)
- Cleveland (76.5%)
- Rochester, New York (73.4%)
- Cincinnati (72.6%)
- Buffalo, New York (70.4%)
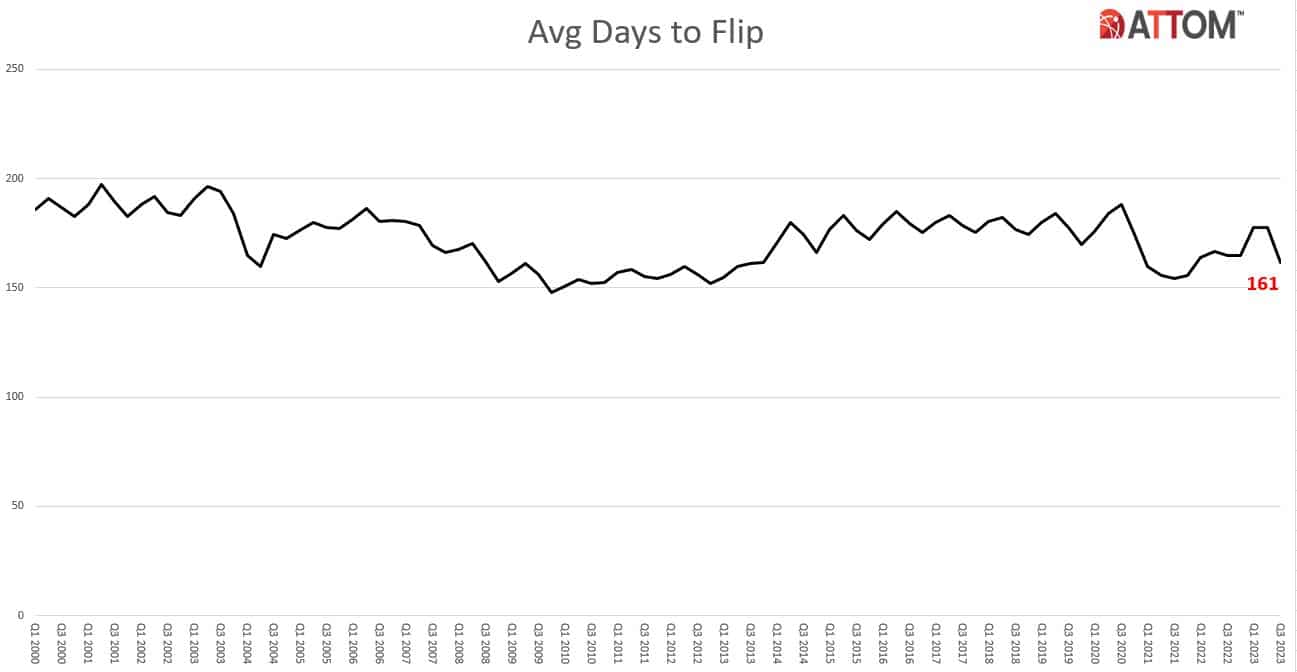
The average time it took from purchase to resale on home flips dropped to 161 days in Q3 of 2023—down from 178 in Q2 of 2023, and 165 days in Q3 of 2022, to the smallest level since Q4 of 2021.
Of the 72,543 U.S. homes flipped in Q3 of 2023, 10.1% were sold to buyers using loans backed by the Federal Housing Administration (FHA), marking the first quarterly decline since Q2 of last year. The latest portion was down from 11.8% in Q2 of 2023, although still up from 8.9% in Q3 of 2022.
Among metro areas with a population of at least 200,000 and at least 50 home flips in Q3 of 2023, those with the highest percentage of flipped properties sold to FHA buyers—typically first-time home purchasers—were recorded in:
- Bakersfield, California (27.7%)
- Visalia, California (27.4%)
- Greeley, Colorado (27.3%)
- Vallejo, California (26.7%)
- Lakeland, Florida (24.9%)
Home flips accounted for at least 10% of all home sales in 175, or 17.9%, of the 979 counties around the U.S. with at least 10 flips in Q3 of 2023. That was below the 23.9% of all counties with enough data to measure in Q2 of 2023. The leaders in Q3 of this year were found in:
- Somerset County (Princess Anne), Maryland (22%)
- Lumpkin County, Georgia (north of Atlanta) (20.4%)
- Lamar County, Georgia (south of Atlanta) (20%)
- Cobb County (Marietta), Georgia (20%)
- Hopewell City/County, Virginia (19.4%)
Click here for more on ATTOM’s 2023 U.S. Home Flipping Report.


