
 DSNews The homepage of the servicing industry


 The Mortgage Bankers Association’s (MBA) monthly Loan Monitoring Survey revealed that the total number of loans now in forbearance decreased by two basis points from 0.33% of servicers’ portfolio volume in the prior month to 0.31% as of September 30, 2023.
According to MBA’s estimate, 155,000 homeowners are currently in forbearance plans. Since March 2020, mortgage servicers have provided forbearance to approximately eight million borrowers.
By reason, 52% of borrowers are in forbearance because of COVID-19, while another 10.2% were in forbearance due to a natural disaster. The remaining 37.8% of borrowers are in forbearance for other reasons, such as a temporary hardship caused by job loss, death, divorce, disability, etc.
In early September, the U.S. Department of Housing and Urban Development (HUD) implemented federal disaster relief for the state of Florida to assist state, tribal and local recovery efforts in the areas impacted by Hurricane Idalia beginning on August 27, 2023, and continuing.
President Joe Biden issued a major disaster declaration to affected individuals in the Florida counties of Citrus, Dixie, Hamilton, Lafayette, Levy, Suwannee, and Taylor. Assistance can include grants for temporary housing and home repairs, low-cost loans to cover uninsured property losses, and other programs to help individuals and business owners recover from the effects of the disaster.
CoreLogic estimates that insured losses across southeastern U.S. due to Hurricane Idalia are at less than $2 billion, encompassing insured losses to residential and commercial properties from wind and storm surge flooding. Storm surge losses do not include impacts to the National Flood Insurance Program (NFIP).
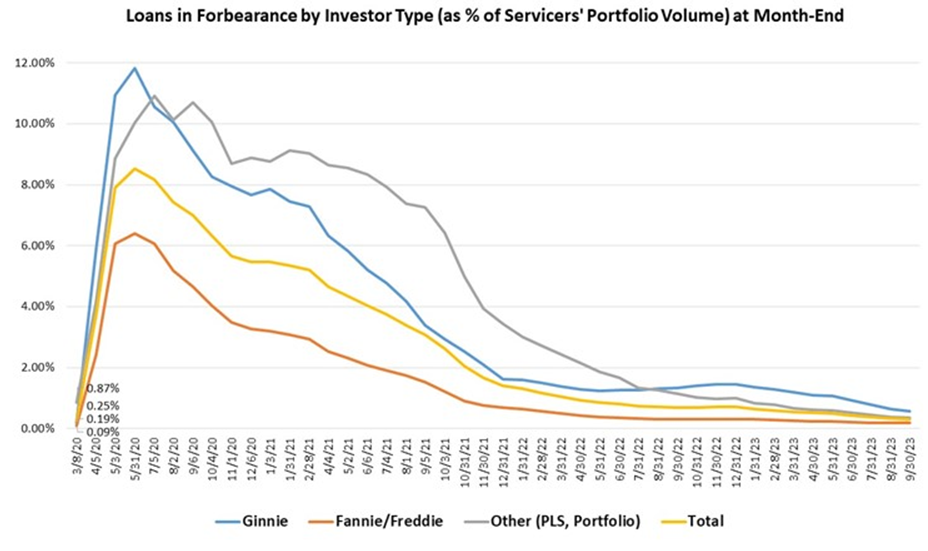
Also in September 2023, the MBA repeated the share of Fannie Mae and Freddie Mac (GSE) loans in forbearance decreased one basis point from 0.19% to 0.18%, while Ginnie Mae loans in forbearance decreased eight basis points from 0.65% to 0.57%, and the forbearance share for portfolio loans and private-label securities (PLS) decreased four basis points from 0.39% to 0.35%.
By stage, 42.7% of total loans in forbearance are in the initial forbearance plan stage, while 48.9% are in a forbearance extension. The remaining 8.4% are forbearance re-entries, including re-entries with extensions.
“The number of loans in forbearance dropped in September, but the overall performance of servicing portfolios and loan workouts declined slightly,” said Marina B. Walsh, CMB, MBA’s VP of Industry Analysis. “MBA’s baseline forecast has a recession in the first half of 2024. Several factors–including unemployment increases, rising property taxes, and insurance, the resumption of student debt payments, and possible natural disasters–may affect loan performance in future months.”
Loans in forbearance as a share of servicing portfolio volume (#) as of September 30, 2023:
- Total: 0.31% (previous month: 0.33%)
- Independent Mortgage Banks (IMBs): 0.37% (previous month: 0.41%)
- Depositories: 0.25% (previous month: 0.27%)
Of the cumulative forbearance exits for the period from July 1, 2020, through September 30, 2023, at the time of forbearance exit:
- 29.4% resulted in a loan deferral/partial claim.
- 17.8% represented borrowers who continued to make their monthly payments during their forbearance period.
- 18.2% represented borrowers who did not make all of their monthly payments and exited forbearance without a loss mitigation plan in place yet.
- 16.1% resulted in a loan modification or trial loan modification.
- 10.8% resulted in reinstatements, in which past-due amounts are paid back when exiting forbearance.
- 6.5% resulted in loans paid off through either a refinance or by selling the home.
- The remaining 1.2% resulted in repayment plans, short sales, deed-in-lieus or other reasons.
Total loans serviced that were current (not delinquent or in foreclosure) as a percent of servicing portfolio volume (#) decreased to 95.83% (on a non-seasonally adjusted basis) in September 2023 from 96.09% in August 2023.
Total completed loan workouts from 2020 and onward (repayment plans, loan deferrals/partial claims, loan modifications) that were current as a percent of total completed workouts decreased to 72.20% in September from 73.43% the previous month.
The five states with the highest share of loans that were current as a percent of servicing portfolio include:
- Washington
- Colorado
- Idaho
- Oregon
- California
The five states with the lowest share of loans that were current as a percent of servicing portfolio include:
- Louisiana
- Mississippi
- Indiana
- New York
- Ohio


