
 DSNews The homepage of the servicing industry


The fall season is projected to offer little relief to homebuyers as temperatures cool, according to the latest Wall Street Journal (WSJ)/Realtor.com Emerging Housing Markets Index. After a slow summer market due to widespread unaffordability, mortgage rates hit a more than two-decade high in October, climbing to 7.57%. Home prices also rose compared to last year, according to the report.
Potential homebuyers are facing not only higher housing costs but also a scarce and dwindling housing supply. Many homeowners are hanging onto a mortgage loan at a lower rate than current figures, making them hesitant to sell their homes. As a result, for-sale inventory has fallen significantly, and existing home sales have stalled as the mismatch between homebuyer demand and for-sale inventory constrains the market. New construction served as a welcomed alternative through the summer, but climbing mortgage rates impacted both buyer activity and builder sentiment, and new home sales dropped 8.7% in August.
Some homebuyers faced with high housing costs are choosing to opt out of the market altogether. However, even amid mounting affordability challenges, the tension between low buyer demand and perhaps even lower seller activity is keeping upward pressure on prices. After mild declines this summer, the national median listing price has crept back above previous-year levels over the last two months and registered 40% higher than pre-pandemic levels in September. Homes spent one day longer on the market than the previous year in September, but time on the market remained two weeks shorter than pre-pandemic. Though housing activity has slowed nationally, demand in affordable locales keeps inventory conditions tight, price growth strong, and time on the market quick.
Today’s homebuyers are faced with elevated inflation, scarce home inventory, and still high home prices, making homebuying a challenging feat for many. The WSJ/Realtor.com The Emerging Housing Markets Index highlighted housing markets that offer home shoppers a lower cost of living, including for homes, and thriving local economies that are attractive but not too crowded.
Fall 2023 Top 10 Emerging Housing Markets:
- Topeka, KS (population 231,783)
- Elkhart-Goshen, IN (206,890)
- Oshkosh-Neenah, WI (170,718)
- Fort Wayne, IN (426,076)
- Lafayette-West Lafayette, IN (226,452)
- Racine, WI (195,846)
- Manchester-Nashua, NH (426,594)
- Concord, NH (156,020)
- Columbus, Ohio (2,161,511)
- Johnson City, TN (210,256)
Homebuyers are getting more for less in some markets.
Home listing prices began to climb again annually in August, fueled in part by homebuyer competition for scarce inventory. While the cost of purchasing a home has stabilized or fallen in some areas, low-priced locales have gained in popularity, leading to accelerating price growth. Despite climbing prices, 15 of the Fall Emerging Housing Markets were lower priced than the national median of $430,000 in September. The housing market has not yet made significant strides towards affordability, and as a result, Fall 2023’s emerging markets continue to lean heavily on outright or relative affordability. The lowest-priced locale on the list, Springfield, Ohio, offered 54% savings on the median-priced home relative to the national level in September.
Housing demand continues to outpace inventory as price growth and for-sale listings diminish.
Though homebuyers are drawn to these areas for low prices and positive quality-of-life metrics, they face low inventory, climbing prices and a quick market pace. The median price of the typical home for sale was just slightly higher than last September nationwide but these top markets continue to see significant price growth both annually and relative to pre-pandemic levels. While the national market has seen prices hover just below or just above last year’s level for the last few months, this quarter’s emerging markets have continued to attract attention due to their affordability and desirability, which has kept price growth strong.
Overall, mortgage rates have picked up even more steam since last quarter, putting even more pressure on homebuyers to lock-in an affordable home.
The average increase in listing price was 19% among the top 20 markets compared to 9.5% nationally for the 12 months ending in September 2023. All of the top markets except Springfield, Ohio, saw price growth exceed the national rate. Compared to pre-pandemic levels, home prices were 69% higher in Q3 of 2023, while nationally, prices climbed 47%.
High demand in the top emerging markets meant that homes sold quickly, preventing the inventory build-up seen nationwide. Inventory increased an average 8% annually in the top 20 markets in the 12 months ending in September, lagging the 34% build up across the 300 largest metros in the same timeframe. Inventory scarcity has kept upward pressure on home prices over the last few years as buyer demand outstripped some supply. Compared to pre-pandemic levels, the top emerging housing markets saw for-sale inventory fall an average 62%, exceeding the 47% national decline.
Because homebuyer demand continues to outmatch limited inventory, home prices have climbed, and market pace is quick. On average, homes spent 35 days on the market in Q3 of 2023, almost three weeks less than the same quarter in 2017-2019. Nationally this difference is just 13 days, with homes spending 46 days on the market in Q3 2023.
Top Housing Markets Falling Out of the Top Emerging Markets:
- Portland-South Portland, Maine (Rank: 22)
- Akron, Ohio (23)
- Milwaukee-Waukesha-West Allis, WI (26)
- Norwich-New London, CT (27)
- Bloomington, IL (29)
- South Bend-Mishawaka, IN/MI (34)
- Columbia, MO (53)
- La Crosse-Onalaska, WI/MN (58)
- Sioux City, Iowa-NE/SD (64)
Mid-sized markets are gaining more and more popularity.
Just five of the 20 markets on this month’s list have a population of over 500,000 people. These mid-sized metros are 46% smaller, on average, than the top 300 U.S. metro areas. These less-congested areas also see commute times 5.4% lower than the nationally average. The largest metros on this quarter’s list are Columbus, Ohio, and Hartford-West Hartford-East Hartford, CT, with populations of 2.2 million and 1.2 million, respectively. Interestingly, these two larger markets, along with three other markets on the list, are state capitols.
These smaller markets are not just desirable for lower prices and quick commutes; they also boast a stronger-than-average job market. On average, the unemployment rate is 3.2% in these markets, 0.4 percentage points lower than the 300-metro average. The report also found that the U.S. job market has continued to expand, adding an unexpectedly high 336,000 jobs in September. Despite the strong employment activity, the unemployment rate ticked up to 3.8%, making these strong job markets all the more appealing. Only Elkhart-Goshen, IN, and Canton-Massillon, Ohio, have unemployment rates higher than the national rate, with 4.3% and 4.0%, respectively.
Larger metros, such as Denver, Seattle, Dallas, and Portland, OR, are among the list of metros that fell the most in this quarter’s rankings. Looking instead at the markets that climbed the most in this quarter’s rankings, we see the popularity of smaller metros emerge. The biggest climbers within the top 50 emerging housing markets include Jackson, MI, Trenton, NJ, and Monroe, MI, each of which has a population of less than 400,000 people. Typical wages were roughly on par with the broader market average. However, homebuyers in these areas benefit from the lower cost of homeownership and the overall lower cost of living. Prices in the top emerging markets on average are less than 94% of the national price level, though four markets have prices that are slightly higher than the national average, with Santa Maria-Santa Barbara, CA, seeing the highest cost of living.
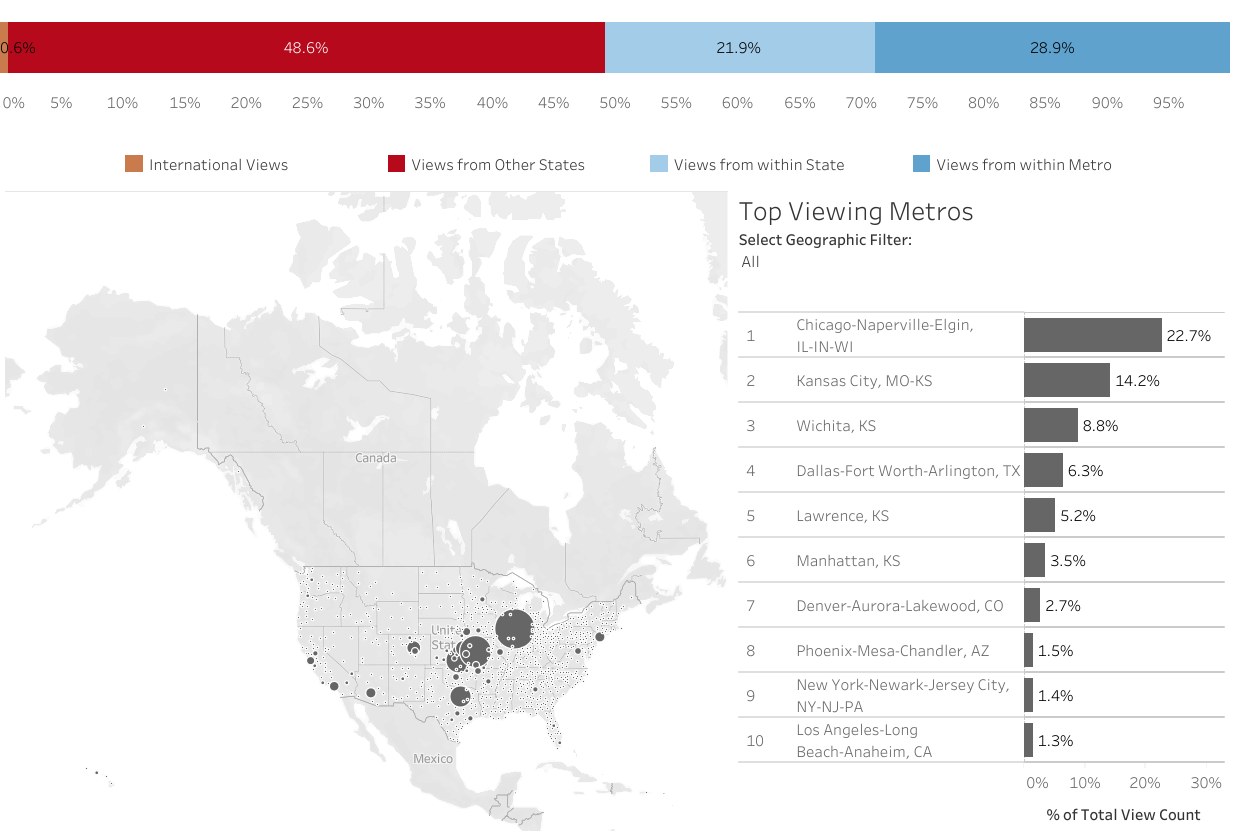
The high-priced Santa Maria-Santa Barbara, CA, region attracted a sizable 3.2% of its listing viewership from shoppers outside of the nation, suggesting that international housing demand is applying pressure to already high prices. International viewership increased 0.3 percentage points year-over-year in Santa Barbara, outpacing the slight increase in international viewership among the top 300 metros. For comparison, the average international viewership share was less than half (1.3%) of the viewership share in Santa Barbara.
Overall, this increase in viewership from home shoppers outside of the metro area emphasizes buyers’ willingness to search far and wide for affordability. This quarter’s markets saw a larger share of out-of-metro viewership than in the previous quarter, showing the increasing push shoppers feel to seek out affordability as mortgage rate pressure increases.
To read the full report, including more data, charts, and methodology, click here.


