
 DSNews The homepage of the servicing industry


Intercontinental Exchange, Inc. (ICE), has released the following “First Look” at November 2023 month-end mortgage performance statistics derived from its loan-level database representing the majority of the national mortgage market.
- The national delinquency rate edged higher to 3.39% in November—down 10 basis points (BPS) from the same time last year—but remains 64 BPS below pre-pandemic levels.
Key Findings:
- While delinquencies remain low overall, the rate among FHA loans is now at a 9-year high (excluding the immediate aftermath of the pandemic) and will be worth watching closely in 2024.
- Early-stage delinquencies among VA loans hit their highest non-pandemic levels since 2009, as rising interest rates have begun to impact performance among recently originated loans.
- GSE mortgages have been more resilient, with early-stage delinquencies holding stronger and overall delinquency rates less than half the national average at 1.51%.
- Serious delinquencies (90+ days past due) rose to 459K but remain down 123K (-21%) from November 2022.
- Foreclosure starts decreased by 12.2% in November to 29K, with active foreclosure inventory falling to 216K, some 23% and 24% below 2019 levels, respectively.
- Prepayment activity fell again under continued pressure from seasonal homebuying patterns, along with the residual effects of 30-year rates climbing above 7.75% the month prior.
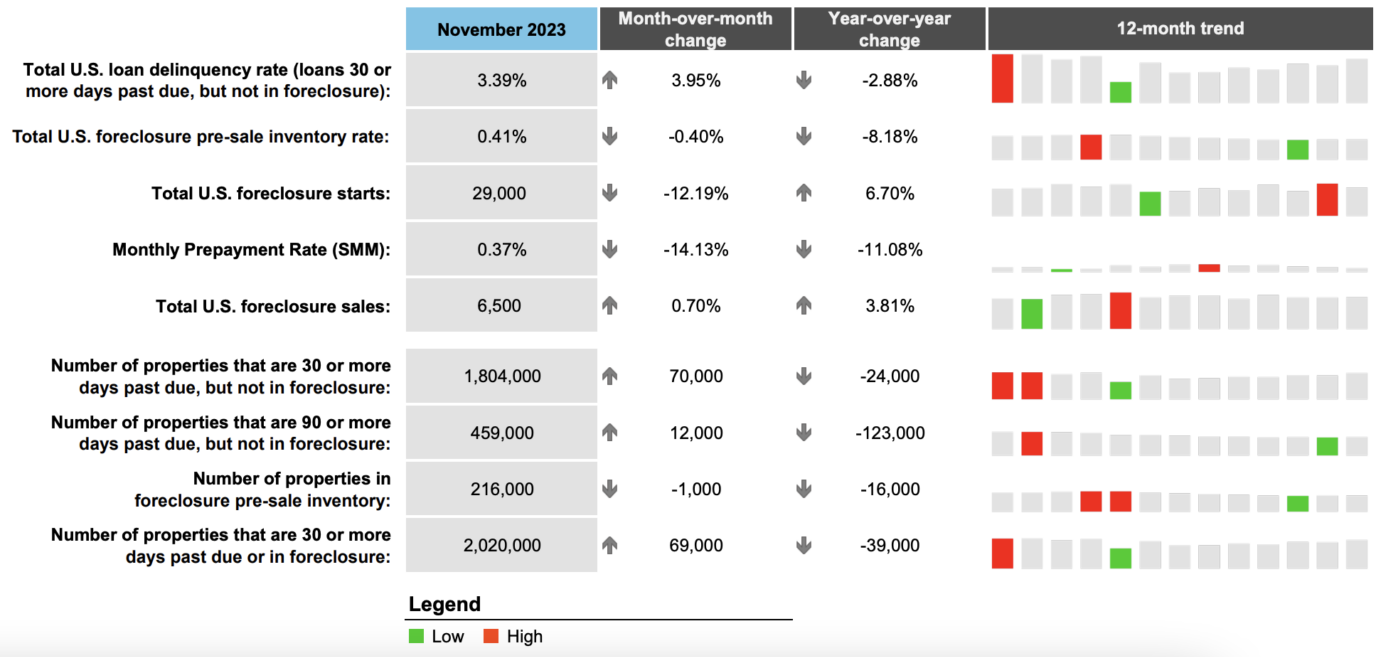
Data as of November 30, 2023:
Total U.S. loan delinquency rate (loans 30 or more days past due, but not in foreclosure): 3.39%
- Month-over-month change: 3.95%
- Year-over-year change: -2.88%
Total U.S. foreclosure pre-sale inventory rate: 0.41%
- Month-over-month change: -0.40%
- Year-over-year change: -8.18%
Total U.S. foreclosure starts: 29,000
- Month-over-month change: -12.19%
- Year-over-year change: 6.70%
Monthly prepayment rate (SMM): 0.37%
- Month-over-month change: -14.13%
- Year-over-year change: -11.08%
Foreclosure sales: 6,500
- Month-over-month change: 0.70%
- Year-over-year change: 3.81%
Number of properties that are 30 or more days past due but not in foreclosure: 1,804,000
- Month-over-month change: 70,000
- Year-over-year change: -24,000
Number of properties that are 90 or more days past due but not in foreclosure: 459,000
- Month-over-month change: 12,000
- Year-over-year change: -123,000
Number of properties in foreclosure pre-sale inventory: 216,000
- Month-over-month change: -1,000
- Year-over-year change: -16,000
Number of properties that are 30 or more days past due or in foreclosure: 2,020,000
- Month-over-month change: 69,000
- Year-over-year change: -39,000
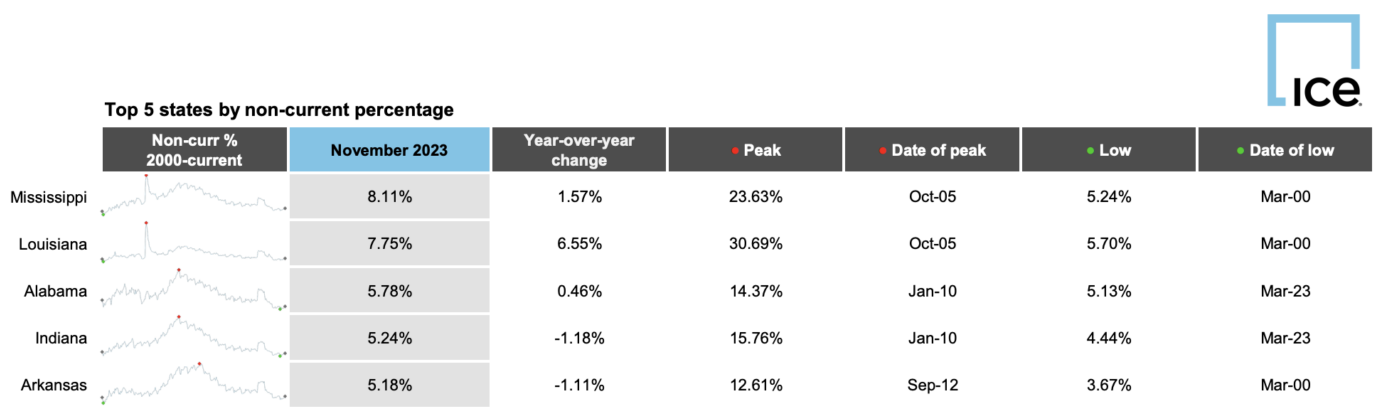
Top Five States by Non-Current Percentage:
- Mississippi: 8.11%
- Louisiana: 7.75%
- Alabama: 5.78%
- Indiana: 5.24%
- Arkansas: 5.18%
Bottom Five States by Non-Current Percentage:
- California: 2.24%
- Idaho: 2.16%
- Washington: 2.07%
- Montana: 2.06%
- Colorado: 1.99%
Top Five States by 90+ Days Delinquent Percentage:
- Mississippi: 2.12%
- Louisiana: 1.87%
- Alabama: 1.46%
- Arkansas: 1.30%
- Georgia: 1.21%

Top Five States by 12-Month Change in Non-Current Percentage:
- Alaska: -14.58%
- Vermont: -13.06%
- Rhode Island: -11.55%
- North Dakota: -11.19%
- New Hampshire: -10.37%
Bottom Five States by 12-Month Change in Non-Current Percentage:
- Idaho: 7.26%
- Louisiana: 6.55%
- South Dakota: 5.33%
- Hawaii: 4.61%
- Texas: 2.48%
ICE Mortgage Monitor will not publish a report in January. The next ICE Mortgage Monitor will be published on February 5, 2024.
To read the full report, including more data, charts, and methodology, click here.


