
 DSNews The homepage of the servicing industry


As housing demand for homes remain slim, the overall supply of low-cost rentals fell by 3.9 million units over the last decade, according to the Joint Center for Housing Studies State of the Nation’s Housing report. As a new interactive tool released in conjunction with the report shows, the supply of low-cost rentals decreased in every single state, leaving lower- and middle-income renters with even fewer housing options they can afford.
The supply of low-rent units has fallen continuously in the past decade due to rent increases in existing units, tenure conversions out of the rental stock, building condemnations, and demolitions. Adjusting for inflation, the number of units with contract rents below $600 fell from 11.9 million to 8.0 million between 2011 and 2021.
A $600 rent is the maximum amount affordable to households who make $24,000 annually. Additionally, the market lost 1.5 million units with rents between $600 and $799, and 980,000 units with rents between $800 and $1,000 in the same years.
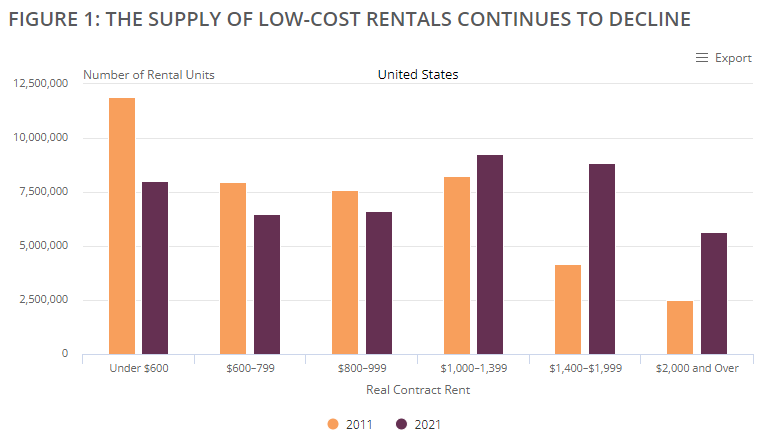
Rent increases and high-end new construction have driven up the number of higher-cost units; the number of units renting for $1,400 or more increased by 7.8 million, to 14.5 million units in 2021. These additions, combined with the declining number of low-rent units, have shifted the overall distribution of rents. Between 2011 and 2021, the share of rental units offering contract rents below $600 decreased by ten percentage points, to just 17% of rentals, while the share renting for $1,400 increased by 16 percentage points, to 31% of rentals.
The decline in low-rent units was geographically widespread. Between 2011 and 2021, 45 states and the District of Columbia lost at least 20% of units with contract rents below $600. Among those, 23 states lost at least 30% of units at this rent level, and 8 states (Arizona, Nevada, Texas, Colorado, Idaho, Oregon, Florida, and New Hampshire) lost at least 40%.
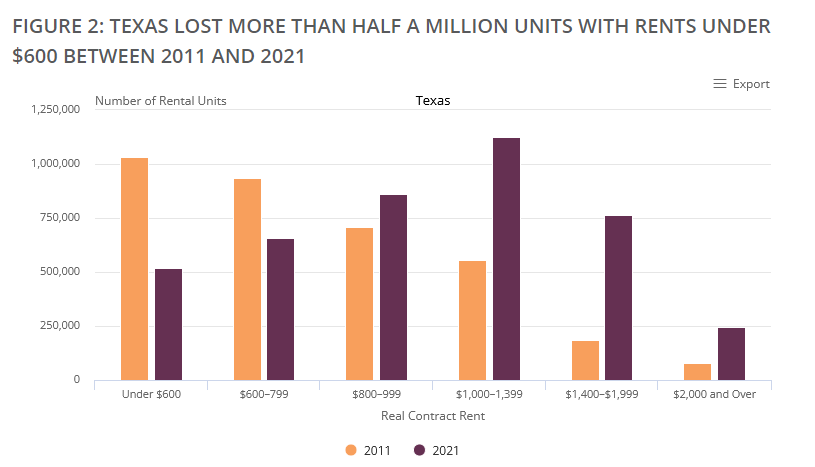
Many of the states with the largest declines in low-rent units were previously more affordable places in the South that have seen increasing rental demand in recent years. Texas had the largest decline of any state, losing 512,000 units with rents below $600, which was half of its low-rent stock (Figure 2). These losses came amid significant gains at the high end, including 742,000 units renting for $1,400 or more.
Other states with particularly large declines in low-rent units included North Carolina (202,000 units), Georgia (159,000 units), and Tennessee (129,000 units), each of which had among the largest growths in the number of renter households of any state in the last decade and at the same time gained large numbers of higher-rent units.
The supply of low-rent units decreased even in affordable states that did not see rapid rental demand, including Ohio (247,000 units), Michigan (140,000 units), Missouri (120,000 units), and Indiana (114,000 units). These states notably had some of the highest numbers and shares of low-cost rentals in 2011, with units renting for less than $600 ranging from 35 to 46% of rentals as compared to the national rate of 27%. These losses put housing in these previously more affordable states increasingly out of reach for lower-income households.
In more expensive states that had fewer low-cost rentals in 2011, the losses extended higher up the rent spectrum. Nine states—California, New York, New Jersey, Massachusetts, Hawaii, Maryland, Washington, Virginia, and New Hampshire—had net losses in units at all rent levels up to $1,400. In California, where just 9.6% of units rented for less than $600 in 2011, the supply of low-rent units declined by 152,000.
However, California also lost an additional 633,000 units renting for between $600 and $1,000 and an astounding 677,000 units renting for $1,000 to $1,399—the largest decline of any state.
The long-term decline in low-rent units is not only geographically widespread but has accelerated in recent years, contributing to worsening affordability for renters. The market lost 1.2 million units with rents below $600 between 2019 and 2021 alone, which was also a period when many lower-income renters experienced major financial setbacks.
Per the report, rising rents and stagnating renter incomes produced the highest number of cost-burdened renters on record in 2021. As the supply of low-cost units continues to decline, it will be increasingly difficult for lower-income renters to secure housing they can afford, even in areas that are relatively less expensive.
To read the full report, including more data, charts, and methodology, click here.


