
 DSNews The homepage of the servicing industry


Intercontinental Exchange, Inc. (ICE) has released its November 2023 ICE Mortgage Monitor Report, based on the company’s industry-leading mortgage, real estate, and public records data sets. Interest rates continue to put significant pressure on affordability, which in turn is affecting homebuyer and borrower demand. As ICE VP of Enterprise Research Andy Walden said, October was a particularly challenging month for prospective homebuyers from an interest rate perspective.
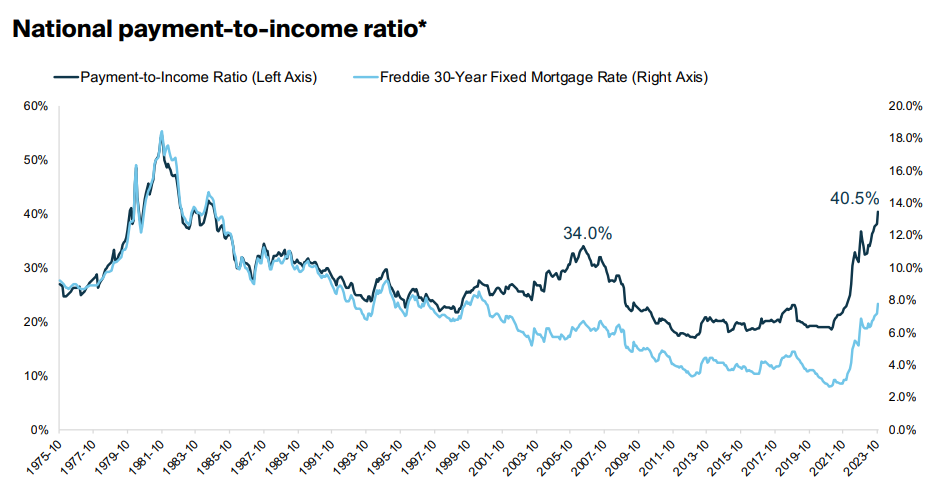
“For all but a single day, interest rates spent the entire month of October above 7.5%, topping out at 7.80% on Oct. 25, according to our ICE U.S. Conforming 30-Year Fixed Mortgage Rate Lock Index,” said Walden. “Mortgage rates haven’t been that high in 23 years, which continues to hammer affordability. The situation was already dire, but recent weeks have seen rates climb to where it now takes nearly 41% of the median monthly income just to make the P&I payment needed to purchase the median-priced home.
That payment has risen by $144 over the past 30 days and now sits above $2,500 a month for the first time in history. Keep in mind that the record-high payment doesn’t include taxes, insurance, or any HOA fees that may be part of the homeowner’s monthly expenses. For the last 35 years, the share of income needed to cover P&I has averaged below 25%. Affordability pressure is not coming from interest rates alone, though. The last time affordability was this bad in the 80s, rates were in the double digits, and the average home was about 3.5 times median income, in stark contrast to today’s price-to-income ratio of nearly 6-to-1."
U.S. mortgage holders have $16.4T of equity in their homes. Of that, $10.6T is 'tappable'—equity a homeowner could borrow against while still retaining 20% equity in their property. The average mortgage holder now has $200K in tappable equity.
Key Highlights:
- Rising rates and home prices have pushed the principal and interest (P&I) payment needed to purchase the median-priced home up $144 per month over the past 30 days to more than $2,500 for the first time.
- It now takes 40.6% of the median household income to cover monthly P&I – after averaging less than 25% over the past 35 years–making for the least affordable housing market since 1984.
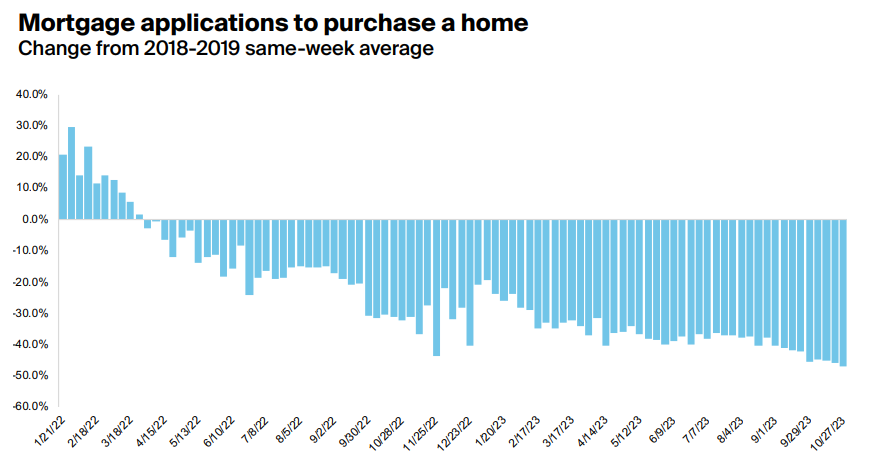
- As a result, purchase-mortgage applications fell to 47% below pre-pandemic levels the week of Oct. 26 – the weakest they’ve been since rates began to rise.
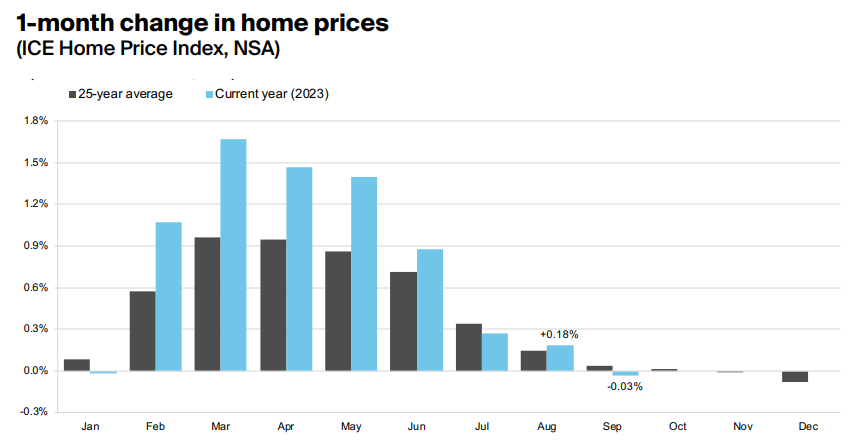
- Further, annual home price growth continued to accelerate to +4.3% in September, though the monthly gain (+0.39%) was the weakest since January and a marked downshift from August’s revised +0.61%.
- However, with rates above 7.5%, affordability is at a 39-year low and purchase applications are waning; given these conditions it’s fair to expect prices to weaken later in 2023.
- Rising prices have brought mortgage-holder equity to within 2% of last year’s record highs in Q3 at $16.4T, $10.6T of which is available for homeowners to borrow against while keeping a 20% equity stake in the home.
- The bulk of refinance activity is equity driven, but retention of consumers post-refi is at its lowest in 17 years, due to an inability to identify and effectively market to those most likely to transact in this market.
“Historically tight inventory levels have been further bolstering prices, which hit yet another all-time high in September, with the annual growth rate accelerating to 4.3% from effectively flat just four months before. That said, the pace of monthly gains slowed to +0.39% in September, marking the smallest seasonally adjusted gain since January. Rates are up 75 basis points from when September’s closed sales went under contract, which has cut consumer buying power by another 8% in the time since. Now, with rates above 7.5% and affordability at a 39-year low, it’s fair to expect prices to weaken later in 2023.”
While price growth cooled in 49 of the 50 largest U.S. markets in September (Cleveland the sole exception), seasonally adjusted prices declined in just two — Austin (-0.31%) and New Orleans (-0.14%)—with prices holding flat in much of Texas and Oklahoma. Ohio, benefiting from comparatively strong home affordability, continues to see some of the highest home price growth rates in the nation. Cincinnati led all markets with prices rising +0.83% in the month, followed by Cleveland at +0.79% and Columbus at +0.72%. Miami, while one of the least affordable markets in the U.S., saw the third-strongest monthly growth in September at +0.75%, with inventory still 47% below pre-pandemic averages.
Other strong markets included: Atlanta, Detroit, Providence, Charlotte, and Orlando, while Houston, Dallas, Memphis, Sacramento, Denver, and Nashville ranked near the bottom.
According to the report, consumer demand is already showing further signs of stress. Purchase-mortgage applications fell 47% below pre-pandemic levels the week of Oct. 26—the weakest they’ve been since rates began to rise last year. Though purchase lending should remain lenders’ primary focus given that it has driven more than 85% of all volume in recent months, Walden noted that recent refinance activity has been primarily equity-driven cash-out transactions.
“The rate/term refinance market is essentially nonexistent today,” said Walden. “In fact, the refinance market in general is but a shadow of what it once was. There are pockets of cash-out lending occurring among a particular set of borrowers, but even that has been a niche market. Given that homeowner equity has risen alongside home prices and is now within 2% of the peaks we saw in 2022, it makes sense that cash-outs would still appeal to some borrowers. Together, U.S. mortgage holders have some $16.4T of equity in their homes. Of that total, $10.6T is what we refer to as ‘tappable equity,’ meaning the amount a homeowner could borrow against while keeping at least a 20% equity stake in their property. Unfortunately, with borrower retention at a 17-year low, lenders are losing customers seeking to tap equity via cash-outs. What’s notable is that they are losing this business not due to their rate offerings but rather an inability to identify and market to those borrowers likely to transact in today's market.”
Overall, annual home price growth rates rose in roughly 90% of U.S. markets, despite slower month-over-month growth in September.
To read the full report, including more data, charts, and methodology, click here.


